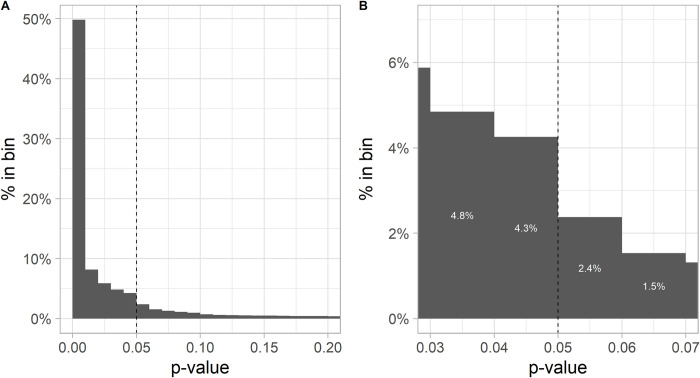
Fig 3. Histogram of p-values from the test values.
Distribution of p-values in 0.01 binwidth. The y-axis denotes the probability of falling in the respective bin. This binwidth closely matches the 5% caliper around the 5% significance threshold. Panel A shows the distribution in the range between 0 and 0.2, higher values are dropped because of their rare occurrence. Panel B shows the bins around the 5% significance threshold. The results of the just significant (4%) and just nonsignificant caliper (2%) can then be used to calculate the publication bias and p-hacking rate.

