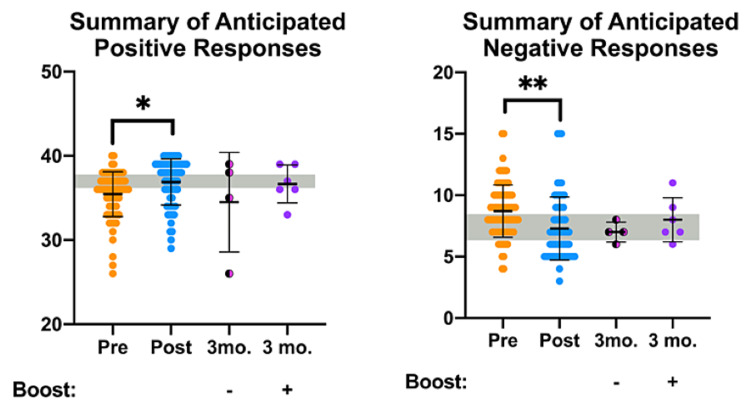
Figure 3. Attitude OOART responses categorized by "positive" and "negative" views of people with OUD or people who experience an opioid overdose are presented from pre-OOART (orange dots), post-OOART (blue dots), three-month-post-OOART without booster training (half-black, half-pink dots), and three-month-post-OOART with booster training (purple dots).
Pre-OOART (n = 82), post-OOART (n = 65), three-month-post-OOART (n = 4), and three-month-post-OOART with booster training (n = 6), mean ± standard deviation. A one-way ANOVA with Tukey's multiple-comparisons test was used to determine statistical significance: *p < 0.05 and **p < 0.01.
OOART, opioid overdose awareness and reversal training; ANOVA, analysis of variance.

