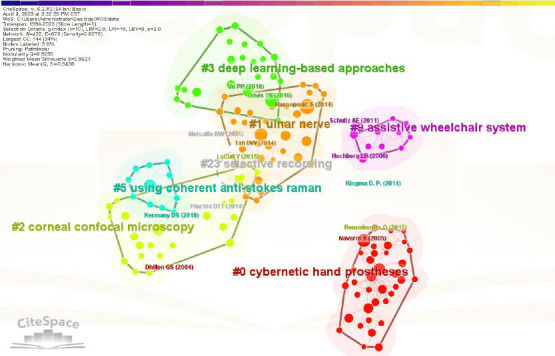
Figure 6.

Literature co-citation cluster map regarding the application of artificial intelligence in peripheral nerve injury and repair (data from 613 articles retrieved from the Web of Science Core Collection database).
The block color of a cluster indicates the year in which the co-citation relationship first occurred in this cluster. The literature in the blue block was published earlier than that in the green block, while the literature in the yellow block was published later than that in the green block. Node size represents the citation frequency of the literature (represented by the first author's name and the year of publication). The color of the connecting line represents the time of the first citation, and the citation time colors, read from left to right, indicate the range from 1994 to 2023. There are seven cluster categories in the figure (#0–#3, #5, #9, #23).
