. 2023 Oct 3;12:e91997. doi: 10.7554/eLife.91997

Figure 2. Variation in the identity of the 5’ splice site +4 position evolved independently on multiple occasions.

(A) Phylogenetic tree showing the estimated +4 position nucleotide fractions (as stacked bars) of the last common ancestors of 11 clades of Saccharomycotina, plus three outgroup species. The phylogenetic tree used is a collapsed ultrametric version of the species tree generated by Orthofinder from the proteomes of 240 species. Bifurcations are colored by confidence, calculated using the number of single-locus gene trees that support the bifurcation in the Orthofinder STAG algorithm (Emms and Kelly, 2019; Emms and Kelly, 2018) (this measure is generally more stringent than bootstrap values for trees generated using concatenated multiple sequence alignment and maximum likelihood methods). Ancestral nucleotide fractions were calculated using Sankoff Parsimony (Schwartz et al., 2008) (B) Line plots showing the standard deviation of nucleotide frequency ratio phenotypes for 240 species, across the –3 to +7 positions of the 5’SS. Left panel shows all pairwise combinations of single nucleotide frequency phenotypes (e.g. A to U ratio), right panel shows all single nucleotide versus other combinations (e.g. G to H [A, C or U]), as well as R (A or G) to Y (C or U) and S (G or C) to W (A or U) ratios. Human 5'SS consensus sequences are shown for each position as a guide. (C) Stacked histogram and traitgram showing the distribution of 5’SS +4 A to U ratio phenotypes in different Saccharomycotina species. The traitgram shows the predicted path of the 5’SS +4 A to U ratio phenotype through evolutionary time by plotting the branch length on the x-axis, and the measured or estimated phenotype of each node on the y-axis. Clades defined in (A) have been colored accordingly and the paths of 9 key species have been highlighted in bold – for example showing that the last common ancestor of S. cerevisiae and C. albicans is unlikely to have had a +4 U preference phenotype (last common ancestor of S. cerevisiae and C. albicans is also indicated by black arrow). L. starkeyi = Lipomyces starkeyi, C. fragrans = Cephaloascus fragrans, E. gossypii = Eremothecium gossypii.

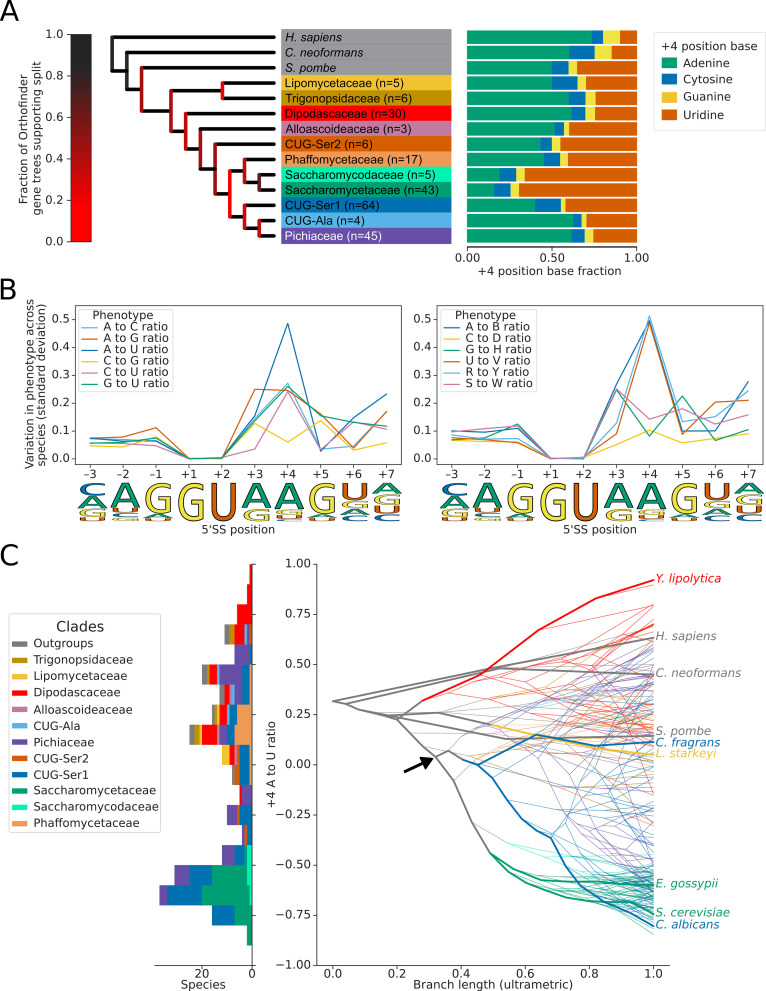
Figure 2.

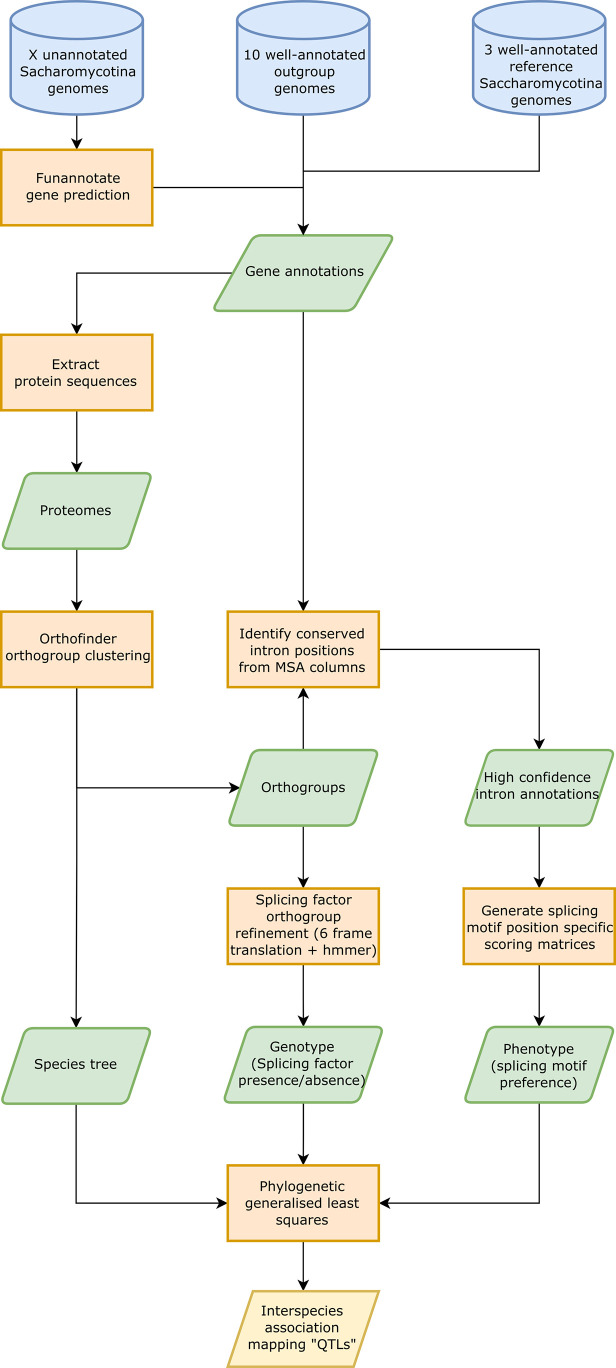
Figure 2—figure supplement 1. Interspecies association mapping pipeline.

Figure 2—figure supplement 1.

Workflow showing the overall method used for generating inter-species association mapping results. Blue cylinders represent input data, orange boxes represent processes, green parallelograms represent intermediate datasets, and yellow parallelograms represent output datasets.
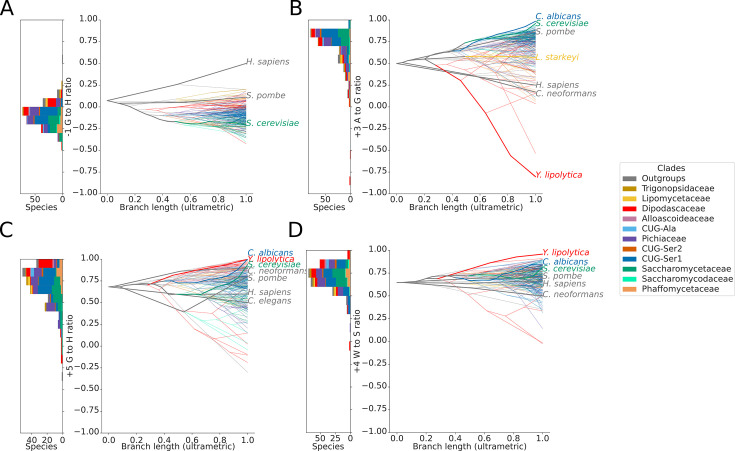
Figure 2—figure supplement 2. Variation in 5’SS splicing signal sequence preference phenotypes across Saccharomycotina.

Figure 2—figure supplement 2.

Stacked histogram and traitgrams showing the distribution of (A) –1 G to H (A, C or U), (B) +3 A to G, (C) +5 G to H and (D) +4 W (A or U) to S (G or C) ratio phenotypes in different Saccharomycotina species. The traitgram shows the predicted path of the phenotypes through evolutionary time by plotting the branch length on the x-axis, and the measured or estimated phenotype of each node on the y-axis. Species have been colored by clade (see key) and the paths of various key species have been highlighted in bold.
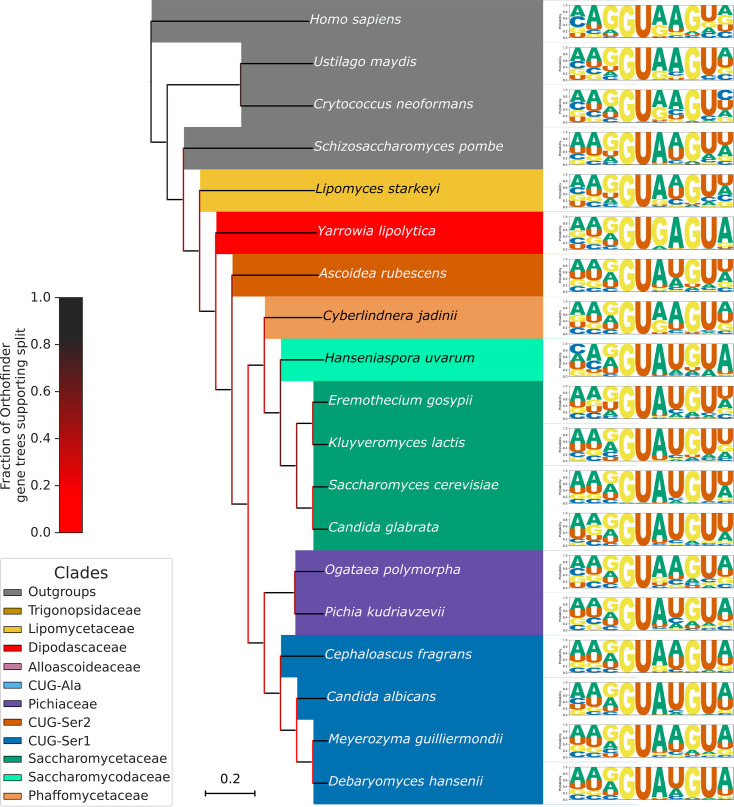
Figure 2—figure supplement 3. Variation in 5’SS splicing signal sequence preference phenotypes across Saccharomycotina.

Figure 2—figure supplement 3.

Pruned Saccharomycotina tree showing the diversity of 5'SS sequence preferences. Species were selected to represent those Saccharomycotina species previously analysed by Schwartz et al., 2008, with new additions which demonstrate that changes in 5'SS +4 preference have occurred multiple times in Saccharomycotina.
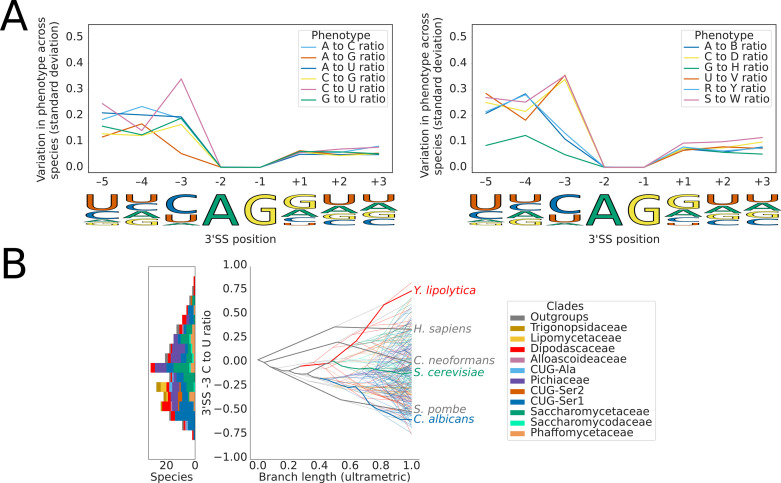
Figure 2—figure supplement 4. Variation in 3’SS splicing signal sequence preference phenotypes across Saccharomycotina.

Figure 2—figure supplement 4.

(A) Line plots showing the standard deviation of nucleotide frequency ratio phenotypes for 240 species, across the –5 to +3 positions of the 3’SS. Left panel shows all pairwise combinations of single nucleotide frequency phenotypes (e.g. A to U ratio), right panel shows all single nucleotide versus other combinations (e.g. G to H [A, C or U]), as well as R (A or G) to Y (C or U) and S (G or C) to W (A or U) ratios. Human 3'SS consensus sequences are shown for each position as a guide. (B) Stacked histogram and traitgram showing the distribution of 3'SS –3 C to U ratio phenotypes in different Saccharomycotina species. The traitgram shows the predicted path of the phenotypes through evolutionary time by plotting the branch length on the x-axis, and the measured or estimated phenotype of each node on the y-axis. Species have been colored by clade (see key) and the paths of various key species have been highlighted in bold.