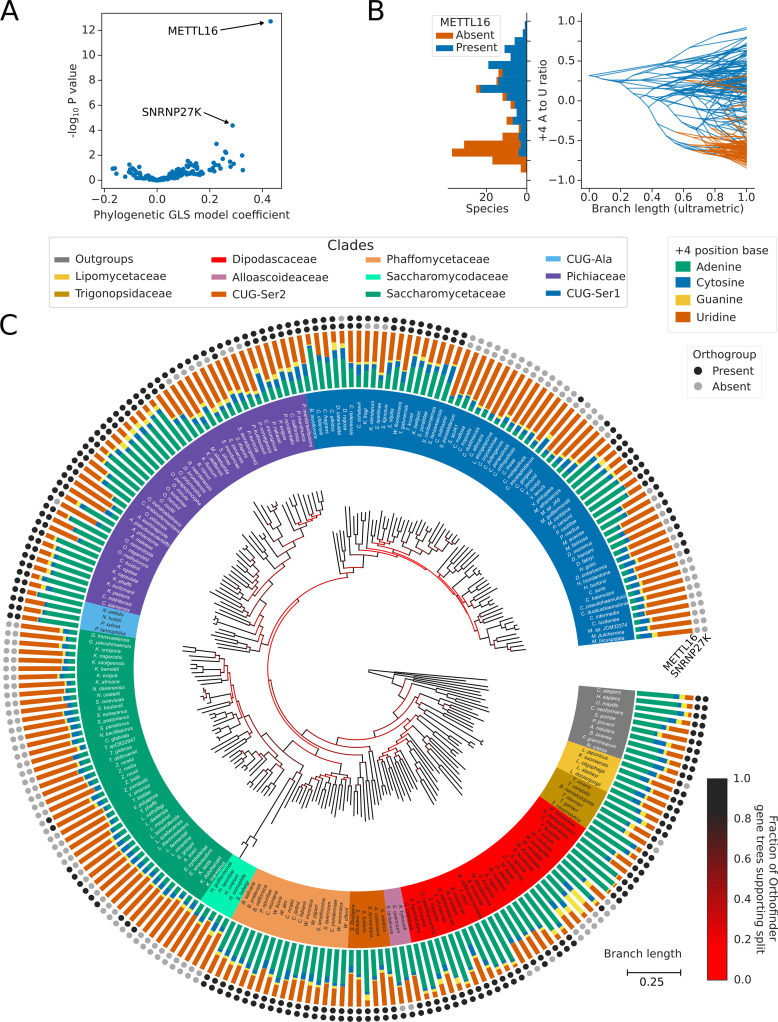
Figure 4. Inter-species association mapping links METTL16 to 5’SS +4 sequence preference.
(A) Volcano plot showing the results of the PGLS analysis of the 5’SS +4 A to U ratio phenotype for orthogroups corresponding to known human splicing factors and METTL16. The magnitude and directionality of the model coefficients (x-axis) are used as a measure of effect size and direction of effect on phenotype, respectively. (B) Stacked histogram and traitgram showing the distribution of 5’SS +4 A to U ratio phenotypes for species which retain or lack a METTL16 ortholog. Ancestral loss events shown on the traitgram are estimated using Dollo parsimony. (C) Circular tree showing the full phylogenetic relationship between 240 Saccharomycotina species identified using Orthofinder. Bifurcations are colored by confidence, calculated using the number of single-locus gene trees that support the bifurcation in the Orthofinder STAG algorithm (Emms and Kelly, 2019; Emms and Kelly, 2018). Clades defined in Figure 2A have been colored accordingly. Stacked bar charts show the 5’SS +4 position nucleotide fractions of each species identified from conserved introns. Outer circles show the presence (black) or absence (grey) of an ortholog from the orthogroups representing METTL16 (inner ring) and SNRNP27K (outer ring), respectively.


