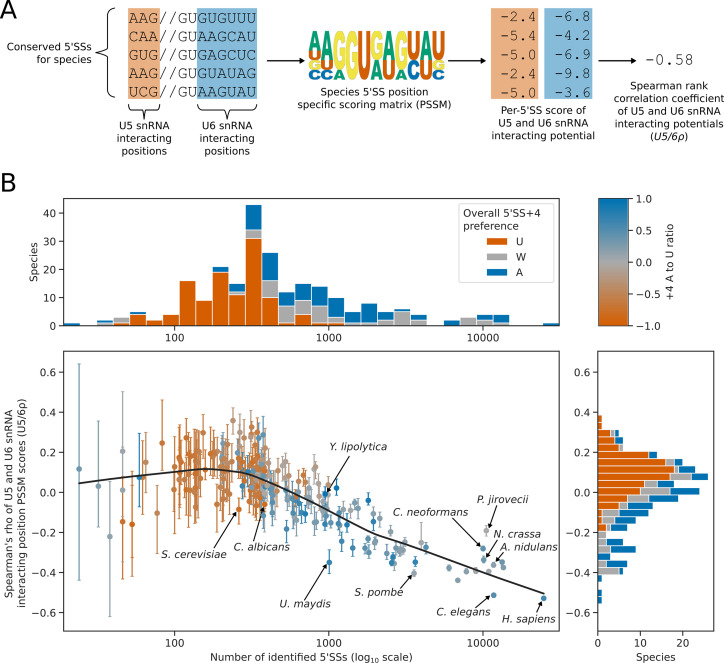
Figure 6. 5’SS +4 sequence preference interacts with intron number and U5/U6 interaction strength patterns.
(A) Diagram showing the calculation of the U5/6ρ metric. For each species, all conserved 5’SSs were used to generate a log2 transformed position specific scoring matrix (PSSM) representing the consensus 5’SS sequence in that species. This PSSM was then used to score how well each individual 5’SS matched the consensus at the U5 and U6 snRNA interacting positions. These scores were used as a measure of U5 and U6 snRNA interaction potential for each 5’SS. Per-5’SS U5 and U6 snRNA interaction potentials were then correlated using the Spearman rank method to give a correlation coefficient for each species. This metric is referred to as U5/6ρ. In the example given, the species has a negative U5/6ρ indicating an overall anti-correlation between the U5 and U6 snRNA interaction potentials of individual 5’SSs. (B) Scatterplot with marginal histograms showing the relationship between the number of conserved introns (scatterplot x-axis), the correlation of U5 and U6snRNA interaction potentials (U5/6ρ, scatterplot y-axis), and 5’SS +4 nucleotide preference (color). Marginal histograms show the distribution of conserved intron size (top margin) and U5/6ρ (right margin) amongst species. For scatterplot points, 5’SS +4 A to U ratio is shaded using the color map shown on the top right. For marginal histograms, 5’SS +4 preference is discretised into an overall preference for either A (A to U ratio >0.2, blue), U (A to U ratio <= –0.2, orange), or no overall preference (–0.2<A to U ratio ≤ 0.2, grey). Confidence intervals for the U5/6ρ metric were obtained by bootstrapped resampling of conserved 5’SSs for each species before performing the calculations described in (A). The lowess (locally weighted scatterplot smoothing) regression line indicates a strong negative relationship between U5/6ρ and conserved intron number in intron rich species, compared to a weak relationship for intron poor species.


