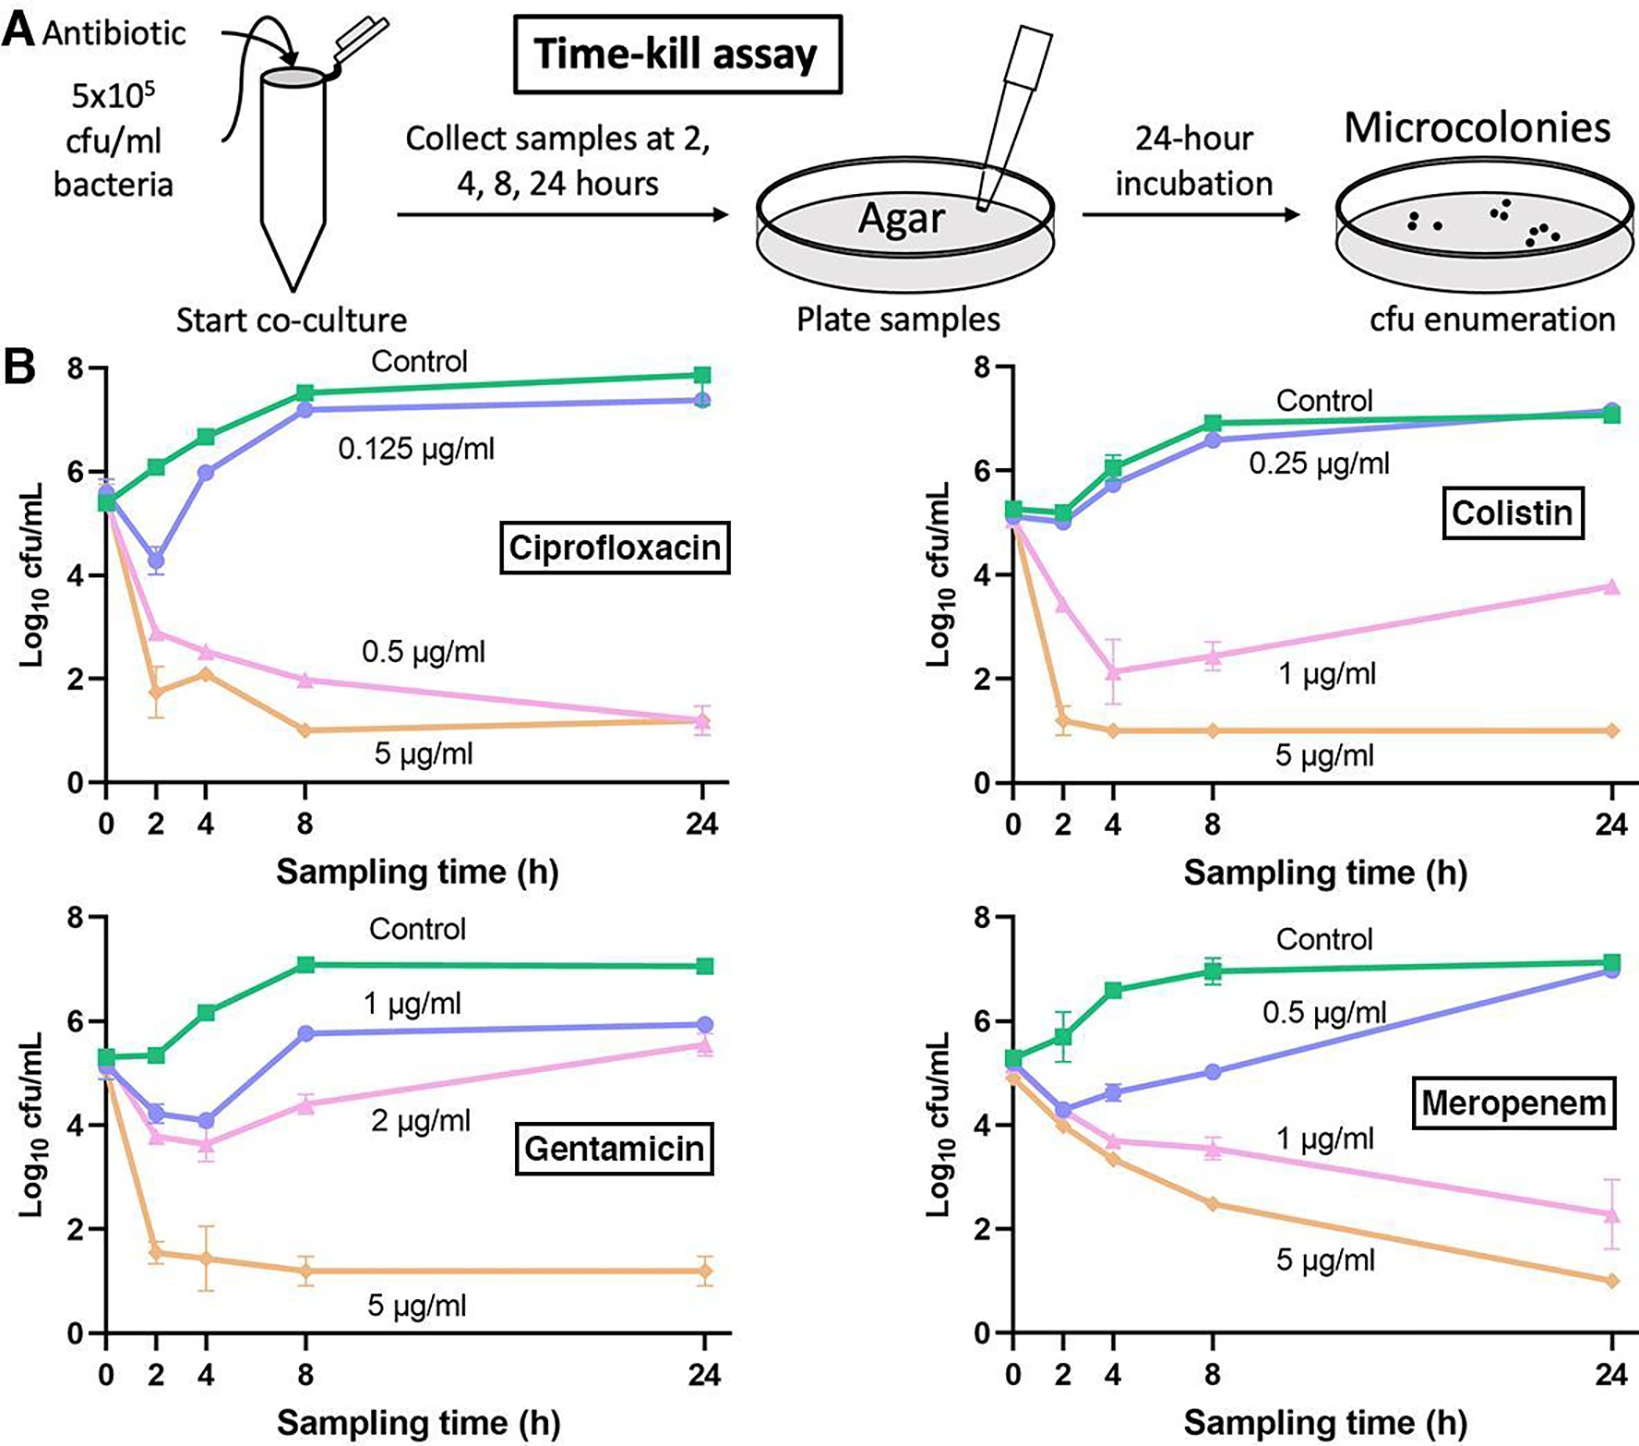
Fig. 3.

Standard time-killing curve results of Pseudomonas aeruginosa PA01. (A) A schematic showing the time-kill assay workflow. In this assay, the bacteria were collected from each broth culture at a series of time points (i.e., the sampling times) and then streaked/cultured (up to 24 h) on an agar plate to obtain cfu count. (B) The time-kill assay results of PA01 against the same antibiotics. Data were pooled and averaged with 3 replicates in each condition. Error bars, mean ± s.d.
