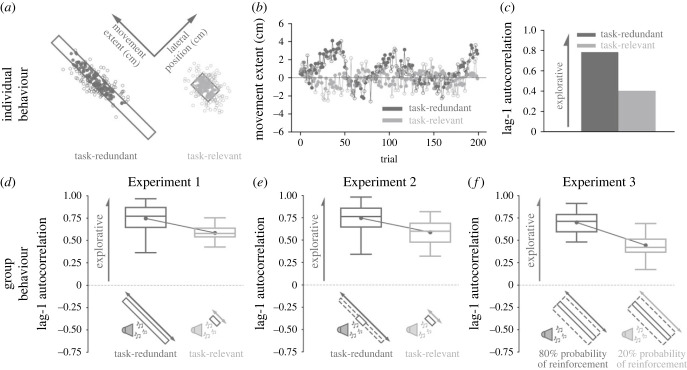
Figure 2.
A priori model predictions. We made theory-driven predictions by simulating (a–c) individual behaviour in Experiment 1 and (d–f) group behaviour in Experiments 1–3 using a model that updates reach aim based on reinforcement feedback while considering different plausible sources of movement variability (equation 1a,b; Model 1). Model parameter values were held constant for all predictions. (a) Successful (filled circle) and unsuccessful (unfilled circle) final hand positions when simulating an individual performing the task-redundant (dark grey) and task-relevant (light grey) conditions in Experiment 1. (b) Corresponding final hand position (y-axis) for each trial (x-axis) along the major axes of the task-redundant and task-relevant targets. Note that there is greater exploration in the task-redundant condition. (c) We quantified exploration by calculating the lag-1 autocorrelation (y-axis) of the trial-by-trial final hand positions along movement extent for each condition (x-axis). Here, a higher lag-1 autocorrelation represents greater exploration along a solution manifold. The model predicts greater lag-1 autocorrelation in the task-redundant condition (dark grey) compared to the task-relevant condition (light grey). (d–f) By using the same parameter values, we simulated 18 participants per condition for the three experiments. (d) For Experiment 1, the model predicted greater lag-1 autocorrelation (y-axis) in the task-redundant condition compared to the task-relevant condition (x-axis). (e) In Experiment 2, the model predicted greater exploration in the task-redundant condition with a large rectangular unseen reward zone compared to the task-relevant condition. (f) In Experiment 3, the model predicted greater exploration in the 80% probability of reinforcement feedback condition relative to the 20% probability of reinforcement feedback condition. Solid circles and connecting lines represent mean lag-1 autocorrelation for each condition. Box and whisker plots display the 25th, 50th and 75th percentiles.

