Figure 5.
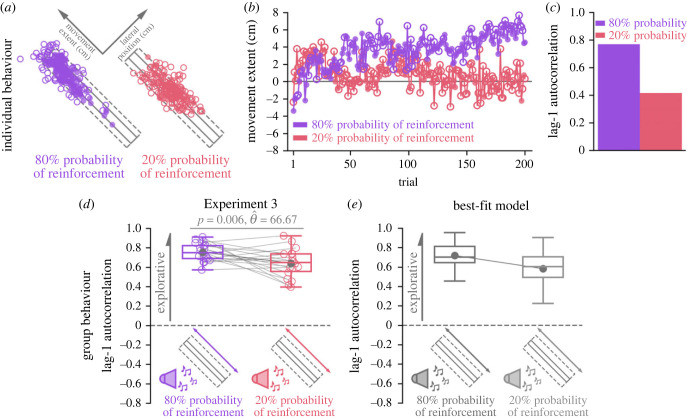
Experiment 3 results. (a) Successful (filled circle) and unsuccessful (unfilled circle) reaches by an individual participant performing the 80% probability of reinforcement (purple) and 20% probability of reinforcement (pink) conditions. (b) Corresponding final hand position coordinates (y-axis) along the major axis of the target over trials (x-axis). (c) This individual displayed greater lag-1 autocorrelation in the 80% probability of reinforcement condition. (d) Participants (n = 18) displayed greater lag-1 autocorrelations (y-axis) with an 80% probability of receiving reinforcement feedback (purple) compared to a 20% probability of receiving reinforcement feedback (pink). Group behaviour aligned with a priori model predictions (figure 2f). (e) Lag-1 autocorrelations (y-axis) for each condition (x-axis) based on simulations from the best-fit model. This model predicts greater lag-1 autocorrelation for the 80% probability of reinforcement feedback condition (purple) because there were more frequent reach aim updates with a higher probability of positive reinforcement feedback. Solid circles and connecting lines represent mean lag-1 autocorrelation for each condition.

