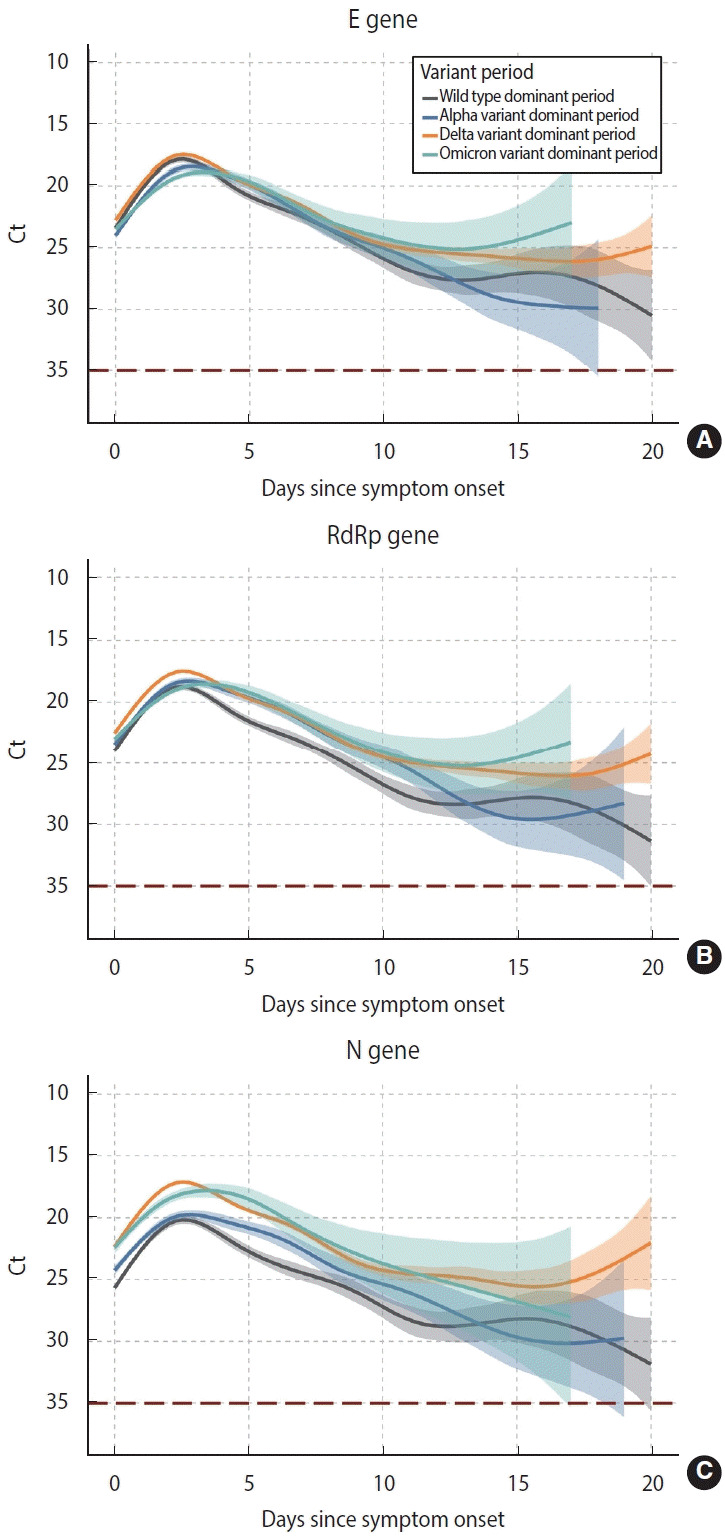
Figure 2.

Comparison of temporal changes of viral shedding according to target genes: the E gene (A), RdRp gene (B), and N gene (C). Each target gene is compared by periods of variant predominance, and the thick curve shows the marginal effect of days since symptom onset of viral load with 95% confidence intervals from a generalized additive mixed model (shaded area). A negative polymerase chain reaction result was coded as a cycle threshold (Ct) value of 35.
