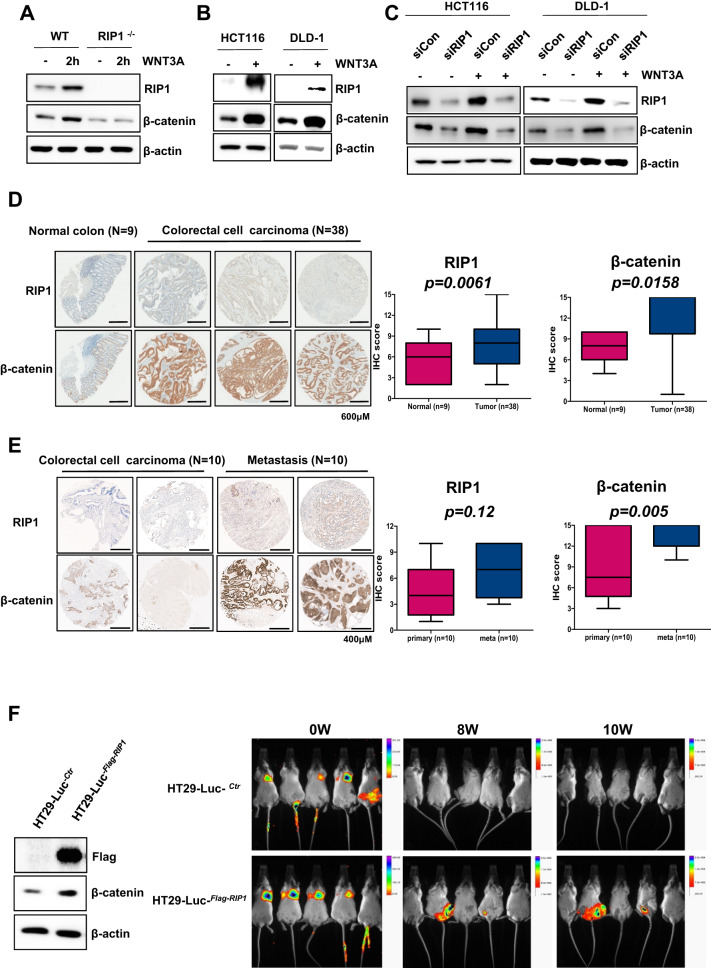
Fig. 1. WNT3A upregulates RIP1 expression, resulting in β-catenin induction in CRC in vitro and in vivo.
A IB analysis of RIP1 and β-catenin levels in wild-type and RIP1-/- MEFs. B IB analysis of RIP1, β-catenin, and β-actin in HCT116 and DLD-1 cells. C IB analysis of RIP1, β-catenin, and β-actin in HCT116 and DLD-1 cells transfected with mock control (Con) siRNA or RIP1 (siRIP1), followed by WNT3A treatment. D IHC analysis of a tumor microarray (CDA3) treated with antibodies against RIP1 and β-catenin. Upper panel: Representative images of normal colorectal tissues and primary CRC tissues. Lower panel: Correlation plot of RIP1 and β-catenin score quantification. E IHC analysis of a second tumor microarray (CO952a) treated with antibodies against RIP1 and β-catenin. Upper panel: Representative images of primary and metastatic CRC tissues. Lower panel: correlation plot of RIP1 and β-catenin score quantification. Boxes and whiskers indicate minimum-to-maximum percentiles. Center line, median value; upper box limit, 75% percentile; lower box limit, 25% percentile; whiskers, minimum or maximum values. F The expression levels of Flag and β-catenin in the HT29-Luc-Ctr and HT29-Luc-RIP1 cells were examined by immunoblotting analysis. β-Actin was used as the loading control. Mice were separated into two groups: The control group was tail-vein injected with HT29-Luc-Ctr, and the experimental group was tail-vein injected with HT29-Luc-RIP1 cells.

