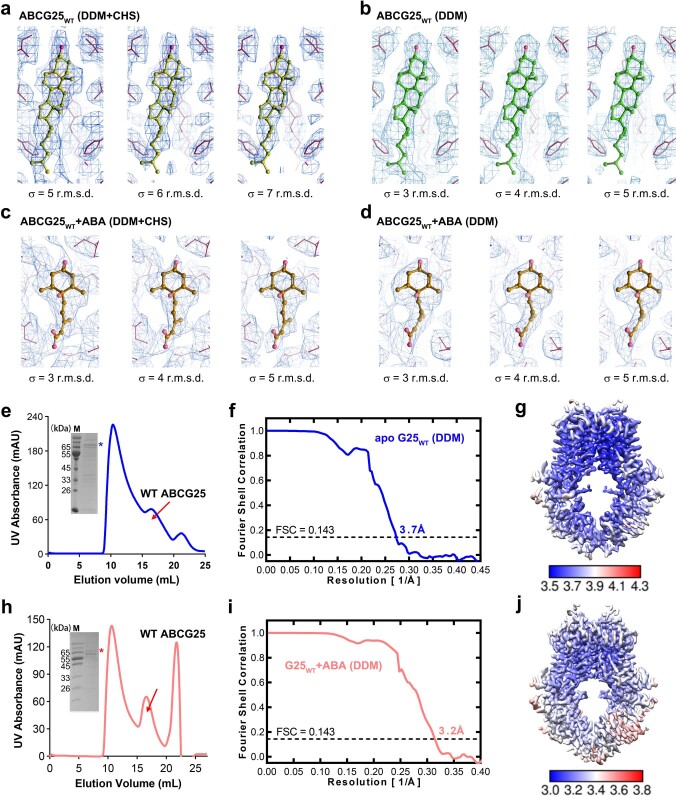
Extended Data Fig. 6. EM densities for the cholesterol and ABA molecules in ABCG25WT.
a, The EM densities interpreted as cholesterol molecules in the apo-state ABCG25WT (DDM plus CHS extraction) map. The maps are prepared in three different contour levels using Coot. b, The EM densities interpreted as cholesterol molecules in the apo-state ABCG25WT (DDM alone extraction) map. The maps are prepared in three different contour levels using Coot. c, The EM densities of ABA molecules in the ABA-bound ABCG25WT (DDM plus CHS extraction) map. The maps are prepared in three different contour levels using Coot. d, The EM densities of ABA molecules in the ABA-bound ABCG25WT (DDM extraction with ABA added) map. The maps are prepared in three different contour levels using Coot. e, A representative gel filtration and Coomassie-blue-staining SDS-PAGE result of wild-type ABCG25 purified with DDM alone extraction. Experiments have been repeated for at least three times with similar results. Uncropped gel can be found in Source Data. f, The gold-standard Fourier shell correlation curve for the overall map of the apo-state ABCG25WT (DDM extraction). The resolution reaches 3.7 Å by a threshold of 0.143. g, The local resolution map of the apo-state ABCG25WT (DDM extraction) calculated using ResMap. h, A representative gel filtration and Coomassie-blue-staining SDS-PAGE result of wild-type ABCG25 purified with DDM extraction and ABA-added during the whole purification steps. Experiments have been repeated for at least three times with similar results. Uncropped gel can be found in Source Data. i, The gold-standard Fourier shell correlation curve for the overall map of the ABA-bound ABCG25WT (DDM extraction with ABA added). The resolution reaches 3.2 Å by a threshold of 0.143. j, The local resolution map of the ABA-bound ABCG25WT (DDM extraction with ABA added) calculated using ResMap.

