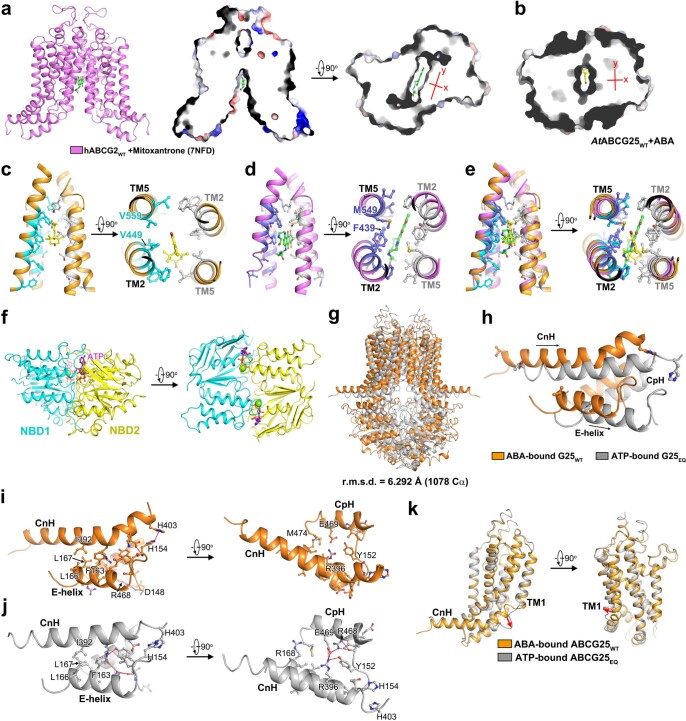
Extended Data Fig. 7. Comparison of the substrate-binding cavity between ABCG25 and ABCG2.
a, The substrate-binding cavity of the mitoxantrone-bound hABCG2WT (7NFD). Mitoxantrone (coloured green) is shown as sticks. The binding cavity exhibits a more planar and elongated feature, as shown by the surface electrostatic potential view. b, A view of the surface electrostatic potential of the substrate-binding cavity of the ABA-bound ABCG25WT. ABA (coloured yellow) is shown as sticks. c, Zoom-in views of residues in the substrate-binding cavity of the ABA-bound ABCG25WT. The ABA molecule and the surrounding residues are shown as sticks. d, Zoom-in views of residues in the substrate-binding cavity of the mitoxantrone-bound hABCG2WT (7NFD). The mitoxantrone molecule and the interacting residues are shown as sticks. e, Structure alignments of the substrate-binding cavity between the ABA-bound ABCG25WT and the mitoxantrone-bound hABCG2WT (7NFD). f, The closed NBDs of ABCG25EQ in the ATP-bound state. g, Structure alignments of ABCG25 in the ABA-bound (coloured orange) and ATP-bound (coloured gray) state. h, Superposition of the three-helix bundle of ABCG25 in the ABA-bound (coloured orange) and ATP-bound state (coloured gray). i, Zoom-in views of the three-helix bundle formed by CnH, CpH and E-helix in the ABA-bound ABCG25WT. The interacting residues are shown as sticks. Hydrogen bonds are shown in red dashed lines. j, Zoom-in views of the three-helix bundle formed by CnH, CpH and E-helix in the ATP-bound ABCG25EQ. The interacting residues are shown as sticks. Hydrogen bonds are shown in red dashed lines. k, Comparison of the TMDs during structure transitions between the ABA-bound (coloured orange) and ATP-bound (coloured gray) states of ABCG25. The rotation of the C-terminal part of CnH is indicated by the red arrows.

