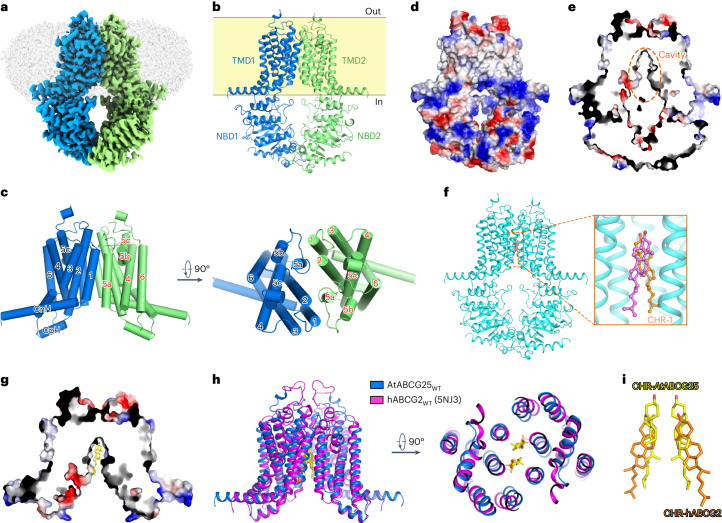
Fig. 2. Architecture of ABCG25WT in the apo state.
a, Overview of the electron density for the ABCG25WT (purified with DDM plus CHS extraction) in the apo state. Densities corresponding to the ABCG25 monomers are coloured blue and green. The detergent density is shown in grey. b, Overall structure of the apo-state ABCG25WT. c, A cartoon representation of the TMDs of the apo-state ABCG25WT. d, Overview of the surface electrostatic potential of the apo-state ABCG25WT from the side of the membrane. Negative and positive charges are coloured red and blue, respectively. e, Section view of the surface electrostatic potential of the apo-state ABCG25WT. The cavity is indicated with orange dashed lines. f, Two cholesterol molecules are modelled in the intracellular pocket according to the observed densities in the EM map of ABCG25WT (purified with DDM plus CHS extraction) in the apo state. g, Section view of the surface electrostatic potential of ABCG25WT in the apo state, with the cholesterol molecules shown as sticks. h, Structural alignment of ABCG25 and hABCG2 (PDB code: 5NJ3) in the cholesterol-bound state. ABCG25 and hABCG2 are coloured blue and magenta, respectively. Carbon atoms of the cholesterol molecules in ABCG25 and hABCG2 are coloured yellow and orange, respectively. i, Superposition of the cholesterol molecules observed in ABCG25 (yellow) and hABCG2 (orange, PDB code: 5NJ3).

