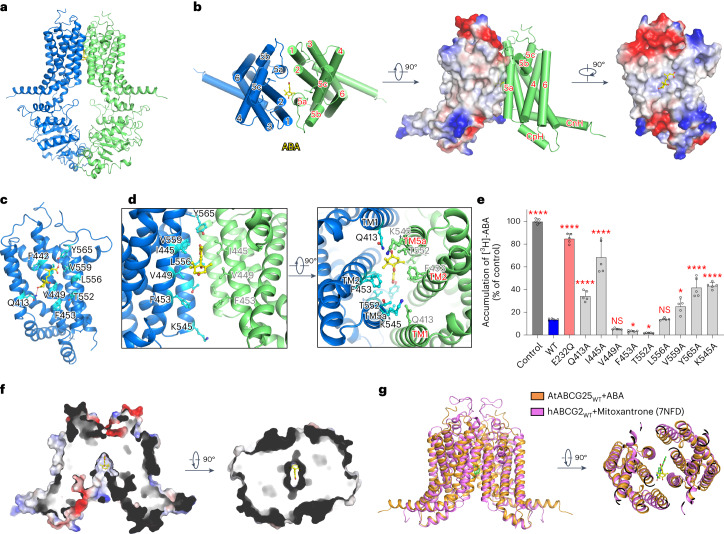
Fig. 3. Architecture of ABCG25WT in the ABA-bound state.
a, Overall structure of ABCG25WT (purified with DDM plus CHS extraction) in the ABA-bound state. ABA is shown in sticks. EM density is shown for ABA using Chimera. b, A cartoon representation of the TMDs of the ABA-bound ABCG25WT and electrostatic surface representation of the ABA binding site. ABA binds to a hydrophobic pocket of ABCG25 in the transmembrane region. c, Coordination of ABA by the ABCG25 monomer. Side chains of the residues close to ABA are shown in sticks, with carbon atoms coloured cyan. d, Zoom-in views of the ABA molecule and the surrounding residues. TMD1 is shown in blue and TMD2 is shown in green. e, Characterization of ABA transport for WT and mutant ABCG25 in Sf9 cells using the ABA loading assay. Five independent experiments were performed for each construct. NS, not significant; *P = 0.0439 for F453A, 0.0138 for T552A and 0.0151 for V559A; ****P < 0.0001 for other mutants versus WT (one-way ANOVA with Dunnett’s multiple comparisons test). Data are mean ± s.d. f, Section view of the surface electrostatic potential of the ABA-bound ABCG25WT, with ABA shown as sticks. g, Structural alignment of ABCG25 and hABCG2 (PDB code: 7NFD) in the substrate-bound state. ABCG25 and hABCG2 are coloured orange and pink, respectively. ABA (yellow) and mitoxantrone (green) are shown as sticks.

