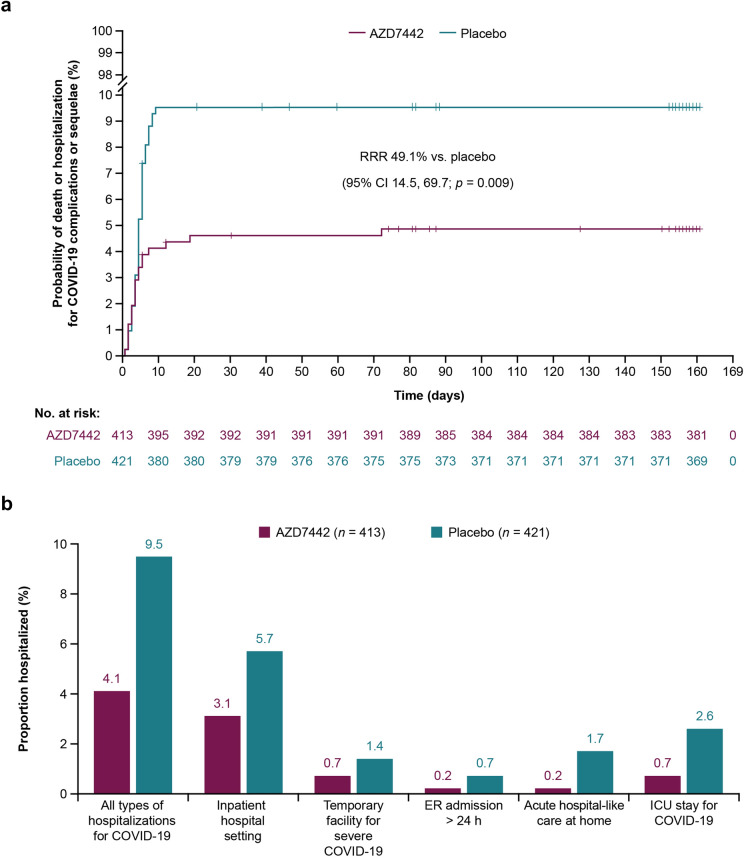
Fig. 1.
a Probability of death or hospitalization for COVID-19 complications or sequelae and b type of hospitalizations through to day 169 (mFAS). Kaplan–Meier curves for time to death from any cause or first hospitalization for COVID-19 complications or sequelae up to day 169 were generated for the two study interventions. Hazard ratio was obtained from a Cox proportional hazards model, with time from symptom onset (≤ 5 versus > 5 days) and risk of progression to severe COVID-19 (high versus low) as covariates. The difference between the groups was assessed via a stratified log-rank test. Vertical lines on the Kaplan–Meier curves represent censored patients. The mFAS comprised all randomized participants who received study drug ≤ 7 days from symptom onset and were not hospitalized at baseline (day 1) for isolation purposes. CI confidence interval, COVID-19 coronavirus disease 2019, ER emergency room, ICU intensive care unit, mFAS modified full analysis set, RRR relative risk reduction

