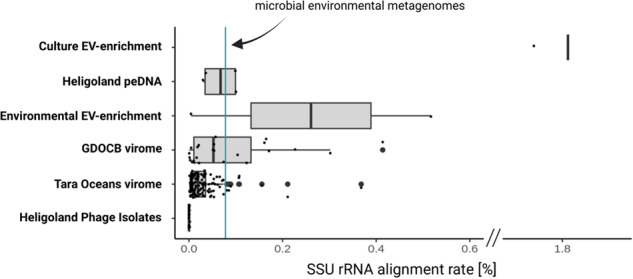
Fig. 2. Comparison of SSU rRNA alignment rates of diverse viromes and EV preparations.

Each dot represents the percentage of reads aligning to either 16S or 18S rRNA genes. The cyan line indicates the average alignment rate for publicly available metagenomes from various environments [19]. “Culture EV enrichment”: a cell-free preparation of EVs from Prochlorococcus cultures [33]. “Heligoland peDNA”: dataset generated in this study from a highly purified (filtration, DNase treatment, gradient purification) <0.2 µm Heligoland water fraction. “Environmental EV enrichment”: Density gradient-purified EVs isolated from seawater samples [33]. “GDOCB virome”: <0.2 µm fraction enriched for VLPs by flow cytometry [42]. “Tara Oceans virome”: <0.2 µm fraction purified by size filtrations and DNase treatment [17]. “Heligoland phage Isolates”: DNA extracted from virus isolates, purified by 0.2 µm size filtration [41].
