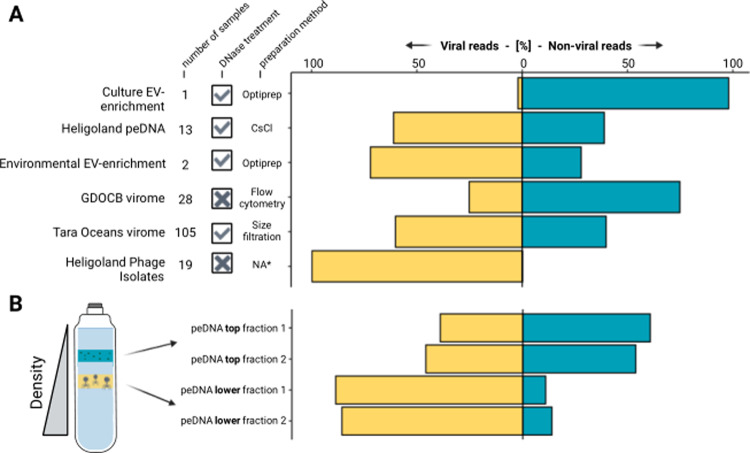
Fig. 3. Non-viral to viral peDNA ratios.
A Non-viral to viral peDNA ratio across different studies. Each bar represents the percentage of read pairs mapping to contigs classified to be non-viral or viral for viromes, peDNA enrichments, EV enrichments and pure phage isolates. Sample size and purification methods are indicated for each sample. B Non-viral to viral peDNA ratio in different fractions of CsCl gradients. Left, schematic view of seawater samples running through CsCl gradients (adapted from [43]). Right, non-viral to viral peDNA ratio for top and bottom fractions in CsCl gradients for the Heligoland peDNA sample.

