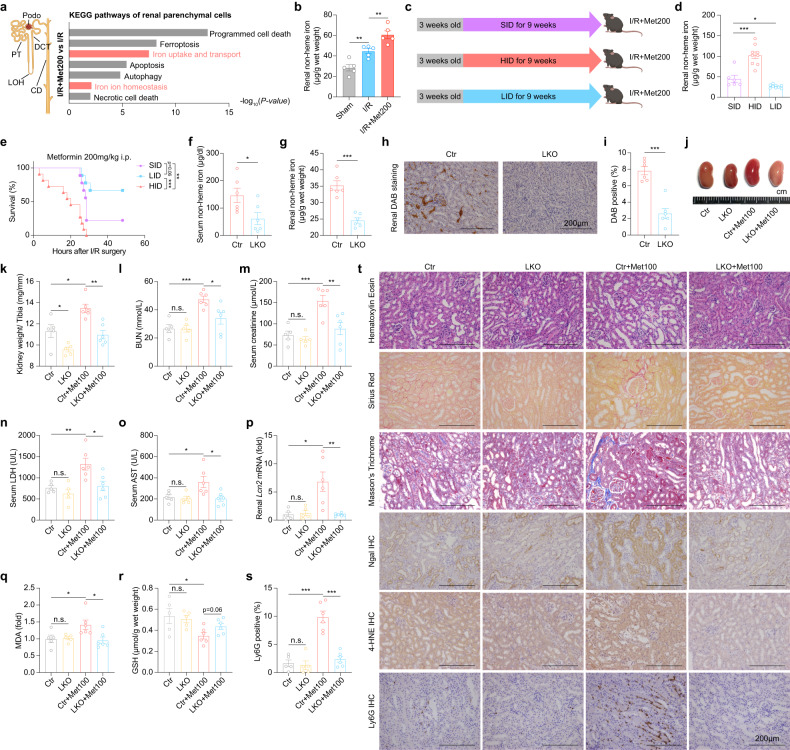
Fig. 3. Decreased iron level alleviates metformin-induced nephrotoxicity in the context of AKI.
a Summary of significantly differentially pathways in the indicated parenchymal cell types of I/R+Met200 vs I/R. b Summary of renal non-heme iron levels measured in the Sham mice, I/R mice, and I/R+Met200 mice. c At 3 weeks of age, mice were fed a standard-iron diet (SID), high-iron diet (HID), or low-iron diet (LID) for 9 weeks, then subjected to I/R+Met200. d Summary of renal non-heme iron levels measured in the indicated mice. e Kaplan–Meier survival curves of the indicated mice (n = 11, 9, and 9 mice in the HID, SID, and LID groups, respectively). f Summary of serum iron levels measured in adult Tmprss6flox/flox and Tmprss6Alb/Alb mice. g Summary of renal non-heme iron levels measured in the indicated mice. h Representative DAB-stained kidney sections from the indicated mice. i Summary of the percentages of DAB-positive area measured in DAB-stained kidney sections. j Representative image of kidneys in the indicated mice. k Summary of the ratio between kidney weight and tibia length measured in the indicated mice. l–o Summary of serum BUN (l), creatinine (m), LDH (n), and AST (o) measured in the indicated mice. p Summary of renal Lcn2 mRNA levels measured in the indicated mice, expressed relative to control. q Summary of renal MDA levels measured in the indicated mice. r Summary of renal reductive GSH levels measured in the indicated mice. s Summary of the percentages of Ly6G-positive area measured in immunostained kidney sections. t Representative H&E-stained, Sirius Red-stained, Masson’s Trichrome-stained, NGAL-stained, 4-HNE-stained and Ly6G-stained kidney sections from the indicated mice. *P < 0.05, **P < 0.01, ***P < 0.001 and n.s., not significant (one-way ANOVA). Survival curve comparison was analyzed by a log-rank Mantel-Cox test. In this and subsequent figures, summary data are represented as the mean ± SEM. See also Supplementary Figs. S9 and S10.

