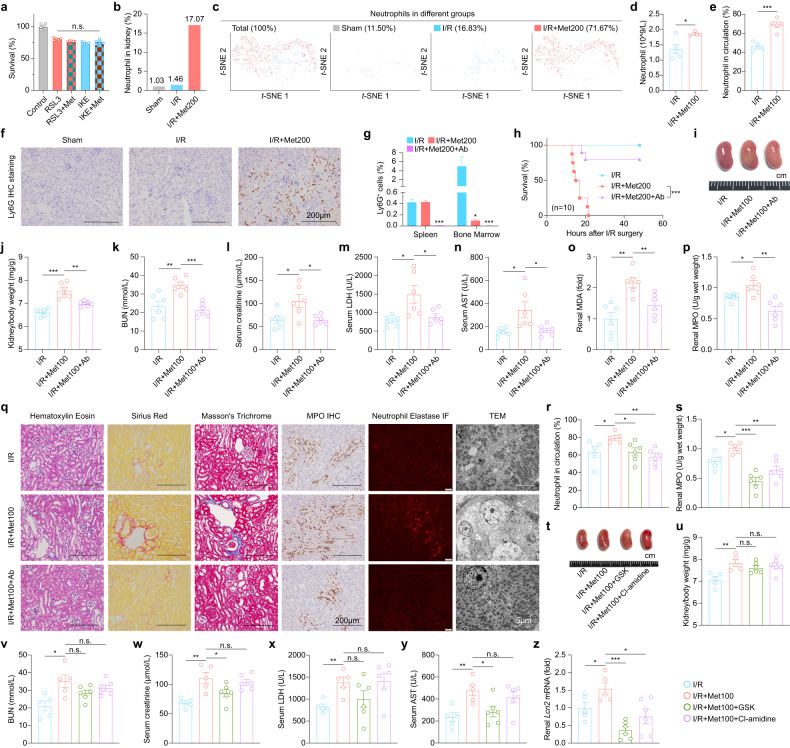
Fig. 4. Neutrophil-released NETosis plays a key role in driving metformin nephrotoxicity.
a Survival of the RSL3 (5 µM) or IKE (10 µM) induced ferroptotic 293T cells intervened with metformin (200 µM) for 24 h. b Summary of the percentages of neutrophils in sham group (n = 2), I/R group (n = 2), and I/R+Met200 group (n = 2). c t-SNE reveals neutrophils cluster in the indicated groups. d Summary of the numbers of neutrophils in circulation in I/R mice and I/R+Met100 mice. e Summary of the percentages of neutrophils in circulation in I/R mice and I/R+Met100 mice. f Representative Ly6G immunohistochemistry (IHC)-stained kidney sections from the indicated groups. g Flow cytometry analysis of the percentages of neutrophils measured in the spleen and bone marrow of the indicated mice; where indicated, metformin and the anti-Ly6G antibody were administered by i.p. injection at 200 mg/kg and 200 µg per mouse, respectively. h Kaplan–Meier survival curves of the indicated mice (n = 10 mice per group). i Representative image of kidneys in the indicated groups; where indicated, metformin and anti-Ly6G was administered at 100 mg/kg and 200 µg per mouse, respectively. j Summary of the kidney to body weight ratio measured in the indicated mice. k–n Summary of serum BUN (k), creatinine (l), LDH (m), and AST (n) measured in the indicated mice. o Summary of renal MDA levels in the indicated mice. p Summary of renal myeloperoxidase (MPO) levels in the indicated mice. q Representative H&E-stained, Sirius Red-stained, Masson’s Trichrome-stained, MPO IHC-stained, Neutrophil Elastase IF-stained, and electron micrographs showing kidney sections from the indicated mice. r Summary of the percentages of neutrophils in circulation in I/R, I/R+Met100, I/R+Met100+GSK, and I/R+Met100+Cl-amidine mice. s Summary of renal MPO level in the indicated mice. t Representative image of kidneys in the indicated groups. u Summary of the kidney to body weight ratio measured in the indicated mice. v–y Summary of serum BUN (v), creatinine (w), LDH (x), and AST (y) measured in the indicated mice. z Summary of renal Lcn2 mRNA levels in the indicated mice, expressed relative to control. *P < 0.05, **P < 0.01, ***P < 0.001 (one-way ANOVA). Survival curve comparison was analyzed by a log-rank Mantel-Cox test. In this and subsequent figures, summary data are represented as the mean ± SEM. See also Supplementary Figs. S11, S12.

