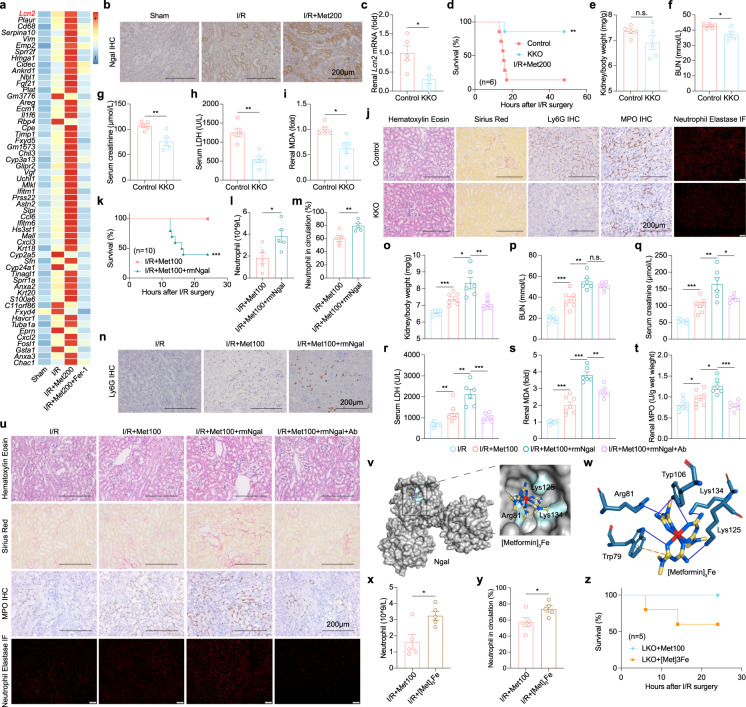
Fig. 5. Kidney-derived NGAL exacerbates metformin nephrotoxicity and interacts with metformin–Fe.
a The heatmap of cluster2 in Supplementary Fig. S10b and summary of Lcn2 mRNA levels in sham group, I/R group, I/R+Met200 group, and I/R+Met200+Fer-1 group according to scRNA-seq data. b Representative NGAL IHC-stained kidney sections from the I/R, I/R+Met100 and I/R+Met100+rmNGAL groups. c Summary of renal Lcn2 mRNA levels in Lcn2 renal specific knockout mice (KKO) and control mice, expressed relative to control. d Kaplan–Meier survival curves of KKO and control mice in I/R+Met200 condition. e Summary of the kidney to body weight ratio measured in the I/R-induced KKO mice and control mice with metformin. f–h Summary of the serum BUN (f), creatinine (g), and LDH (h) measured in the KKO mice and control mice. i Summary of renal MDA levels measured in the KKO mice and control mice. j Representative H&E-stained, Sirius Red-stained, Ly6G IHC-stained, MPO IHC-stained, and Neutrophil Elastase IF-stained kidney sections from the KKO mice and control mice. k Kaplan–Meier survival curves of mice in I/R+Met100 and I/R+Met100+rmNGAL groups. l Summary of the neutrophil numbers in the circulation of the I/R+Met100 and I/R+Met100+rmNGAL mice. m Summary of the percentages of neutrophils in the circulation of the indicated mice. n Representative Ly6G IHC-stained kidney sections from the indicated mice. o Summary of the kidney to body weight ratio measured in I/R+Met100, I/R+Met100+rmNGAL, and I/R+Met100+rmNGAL+Ab mice. p–r Summary of serum BUN (p), creatinine (q), and LDH (r) measured in the indicated mice. s Summary of renal MDA levels measured in the indicated mice. t Summary of renal MPO levels measured in the indicated mice. u Representative H&E-stained, Sirius Red-stained, Ly6G IHC-stained, MPO IHC-stained, and Neutrophil Elastase IF-stained kidney sections from the indicated mice. v Structure of the NGAL protein complexed with metformin and Fe; the inset shows a zoomed in view of the electrostatic surface, with the key residues in NGAL indicated. w Forces between the indicated residues in the NGAL protein and the [Metformin]3Fe complex are shown. x Summary of the neutrophil numbers in the circulation of the mice with metformin or [Metformin]3Fe complex. y Summary of the percentages of neutrophils in the circulation of the indicated mice. z Kaplan–Meier survival curves of the LKO mice with metformin or [Metformin]3Fe complex (n = 5 mice per group). *P < 0.05, **P < 0.01, ***P < 0.001 and n.s., not significant (one-way ANOVA). Survival curve comparison was analyzed by a log-rank Mantel-Cox test. In this and subsequent figures, summary data are represented as the mean ± SEM. See also Supplementary Figs. S13–S17.

