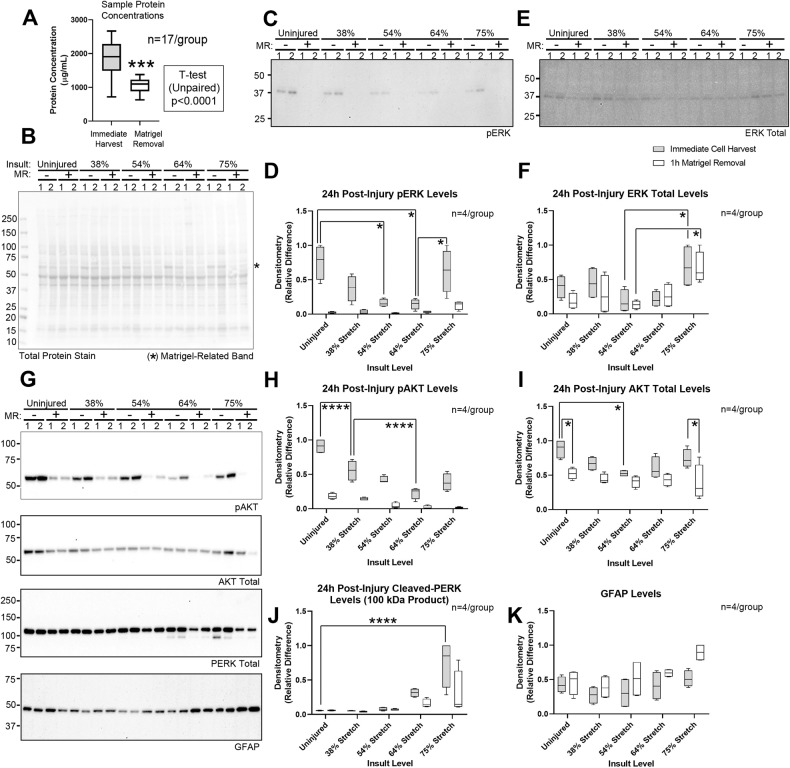
Fig. 2. Optimization of sample collection for signaling studies in the stretch model.
A Total protein concentrations with or without Matrigel removal (MR). B Total protein stain for phosphorylated ERK (pERK) in panel 2 C, in samples processed with (+) or without (−) the MR step (n = 2/group). The asterisk denotes a ~ 60 kDa Matrigel-derived band. C Representative blot of pERK levels (n = 2/group). D Densitometric quantification of pERK normalized to total protein stain from 2 independent culture isolations (n = 4/group). E Representative blot of total ERK levels (n = 2/group). F Densitometric quantification of total ERK normalized to total protein stain (n = 4/group). G Representative blots of phosphorylated AKT (pAKT), total AKT, PERK, and GFAP levels (n = 2/group). H–K Densitometric quantification of pAKT, total AKT, cleaved PERK, and GFAP normalized to total protein stain (n = 4/group). Box plots show median, max, min, and IQR. Data were significant at p < 0.05. *p < 0.05, ***p < 0.001, and ****p < 0.0001. AKT protein kinase B, ERK extracellular signal-regulated kinase, PERK PRKR-like endoplasmic reticulum kinase, GFAP glial fibrillary acidic protein.

