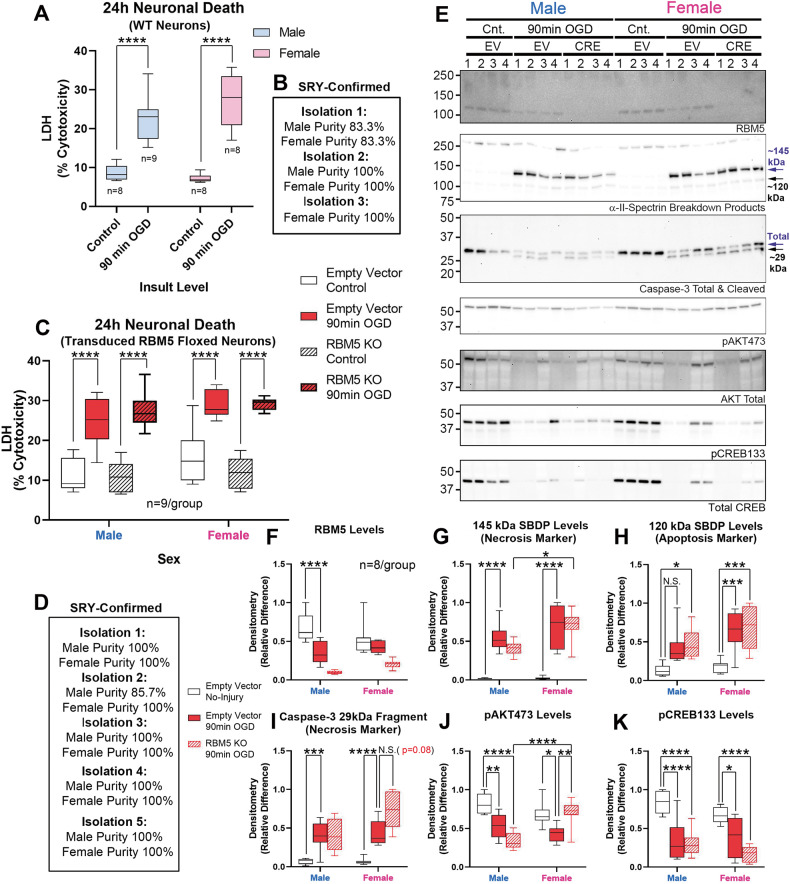
Fig. 5. Effect of RBM5 KO and sex on neuronal survival in OGD.
A Box plots show post-injury LDH levels in sex-separated WT Neurons (n = 8-9/group). B Purity of WT male and female cultures from independent culture isolations in Fig. 5A. C Box plots show post-injury LDH levels (n = 9/group) in control (empty vector) versus CRE (RBM5 KO) neurons. D Purity of male and female floxed cultures from independent culture isolations in Fig. 5C–K. E Representative blots (n = 4/group) for RBM5, SBDPs, caspase-3, pAKT, total AKT, pCREB, and total CREB levels. F–K Densitometric quantification of RBM5, SBDP 145, SBDP 120, caspase-3, pAKT and pCREB normalized to total protein stain (n = 8/group). Box plots show median, max, min, and IQR. Data were significant at p < 0.05. *p < 0.05, **p < 0.01, ***p < 0.001, and ****p < 0.0001. RBM5 RNA-binding Motif 5, SBDPs spectrin breakdown products, AKT protein kinase B, CREB cAMP response element-binding protein.

