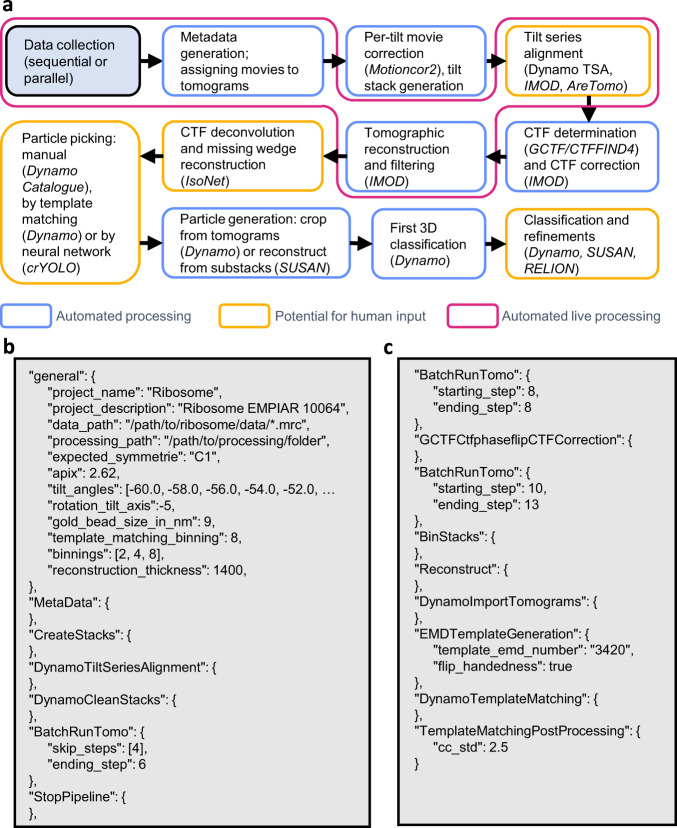
Fig. 1. A standard workflow for data processing in TomoBEAR.
a A flow diagram of data processing with TomoBEAR. Blue boxes outline the steps that are performed fully automatically, orange boxes may require human intervention. The steps highlighted in magenta represent the functionality of live data processing. b, c an example of a.json configuration file that was used for processing the EMPIAR-10064 data set (results below). Panel B contains the “general” section and the steps for processing up to the refinement of gold fiducials. c contains modules for CTF estimation and correction, tomographic reconstruction, and template matching.

