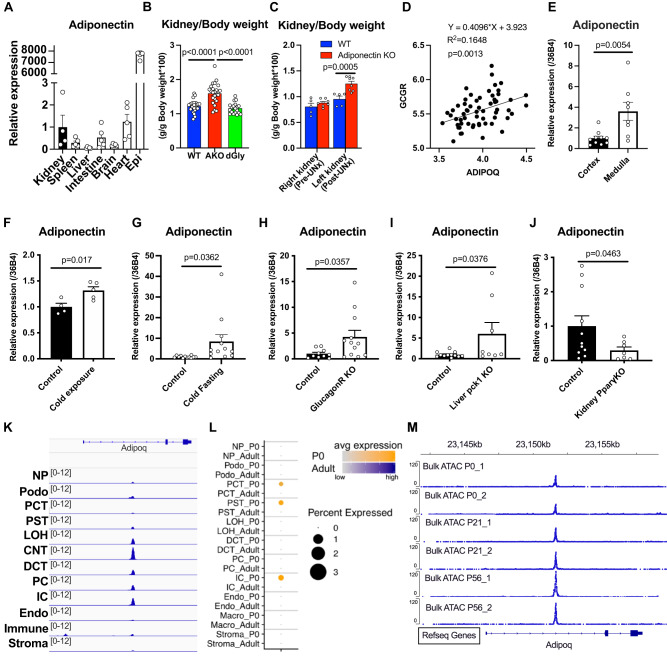
Fig. 1. The expression and regulation of renal adiponectin.
Determination of adiponectin expression levels, regulation and location of adiponectin expression in kidney cells using wildtype, glucagon receptor KO, liver specific Pck1 KO and kidney-specific PPARγ KO mice. A Adiponectin expression in Epididymal adipose tissue (Epi) (n = 5), kidney (n = 4), spleen (n = 5), liver (n = 5), intestine (n = 5), brain (n = 5) and heart (n = 5). B The kidney weight as a percentage of body weight in wild type (WT) (n = 23), adiponectin knockout (AKO) (n = 25) and delta-Gly adiponectin overexpression (dGly) mice (n = 19). P values were determined by Tukey’s multiple comparison test. C The kidney weight as a percentage of body weight before and after unilateral nephrectomy (UNx) (WT n = 5, AKO n = 8) P values were determined by Sidak’s multiple comparison test. D The expressions of ADIPOQ and GCGR in human kidney biopsy samples from Gene Expression Omnibus (n = 60). E Adiponectin expression in the cortex and medulla in the kidney (Cortex n = 10, medulla n = 8). F Adiponectin expression in the whole kidney after 1 week cold exposure under fed conditions (Control n = 4, cold exposure n = 5). G Adiponectin expression in the whole kidney after 3 days cold exposure and 16-hour fasting (Control and cold fasting n = 12). H Adiponectin expression in the kidney of global glucagon receptor KO mice (Control n = 10, Glucagon R KO n = 12). I Adiponectin expression in the kidney of liver-specific Pck1 KO mice (Albumin-Cre/Pck1 flox mice) (Control n = 12, Liver pck1 KO n = 8) J Adiponectin expression in the kidney of kidney-specific PPARγ KO mice (Six2-Cre/PPARγ flox mice) (Control n = 11, Kidney PPARγ KO n = 7). K Single cell-seq reads were mapped to the reference genome. Visualization of adiponectin expression using IGV. Abbreviations are as follows. NP nephron progenitors; Podo podocyte; PCT proximal convoluted tubule; PST proximal straight tubule; LOH ascending loop of Henle; CNT connecting tubule; DCT distal convoluted tubule; PC collecting duct principal cell; IC collecting duct intercalated cell; Endo containing endothelial, vascular, and descending loop of Henle; Immune cells, including macrophages, neutrophils, lymphocytes; Stroma, stromal cell. L Scatter plot representation of adiponectin expression in each kidney cell type in adult kidney and postnatal day (P)0 (P0) kidneys. M ATAC-seq reads mapped to the adiponectin locus was visualized by IGV software. ATAC-seq was performed in duplicate utilizing whole kidney of P0, P21 and P56. Data are mean ± SEM. Unpaired two-tailed student t-tests were performed from E to J.

