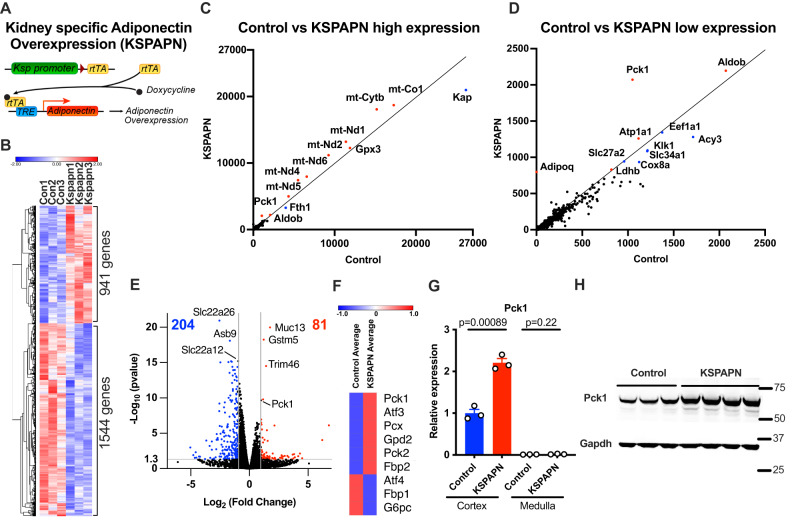
Fig. 2. RNAseq analysis of renal adiponectin overexpression mice exhibit higher gluconeogenic signature.
Whole kidneys were harvested after 4 days of doxycycline 600 mg/kg chow diet treatment with KsprtTA mice (Controls) and KsprtTA/TRE-adiponectin mice (KSPAPN). 3 mouse samples were pooled. 3 RNA-seq data reactions represent a total of 9 mouse samples. A Schematic representation of the doxycycline-inducible kidney-specific adiponectin overexpression mouse model (KSPAPN). B Hierarchical clustering of transcriptional profiles in control and KSPAPN (n = 3). C Scatter plot representation of protein-coding gene transcriptional profiles in controls and KSPAPN mice (n = 3). The range of fpkm is from 0 to 27000. D Scatter plot representation of protein-coding gene transcriptional profiles in controls and KSPAPN mice (n = 3). The range of fpkm is from 0 to 2500. E Volcano plots of protein-coding gene transcriptional profiles comparing P-value vs. fold-change. Unpaired two-tailed student t-tests were performed to determine p-value. While 81 genes were significantly up-regulated, 204 genes were significantly down-regulated. (n = 3). F Hierarchical clustering of genes involved in gluconeogenesis pathway. (n = 3). G Gene expression of Pck1 in the cortex and medulla in control and KSPAPN kidney (n = 3). Unpaired two-tailed student t-tests were performed to determine p value. H Western blot of Pck1 protein in control and KSPAPN kidney (Control n = 3, KSPAPN n = 4). Data are mean ± SEM.

