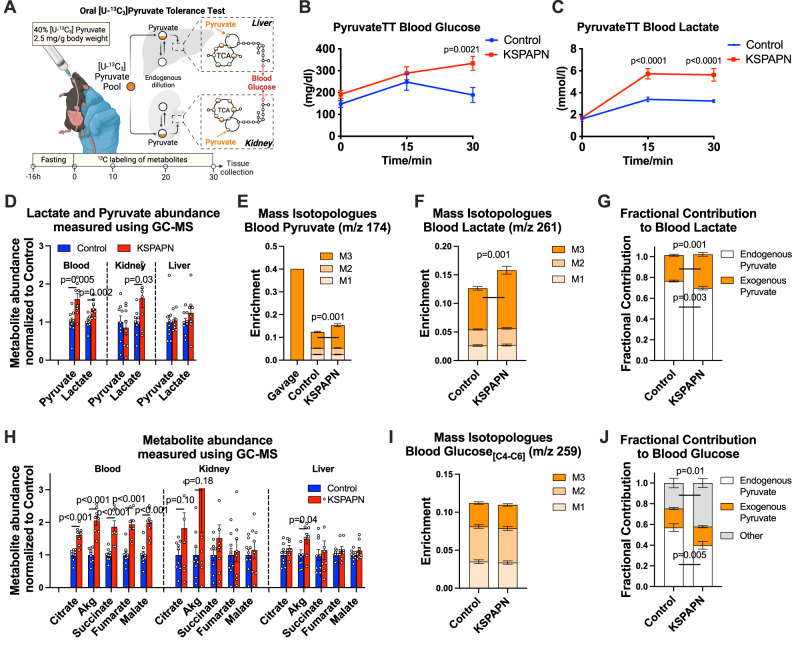
Fig. 4. Adiponectin affects pyruvate metabolism and sources of glucose carbon increases during OPTT.
A Schematic illustration of oral [U-13C3]pyruvate tolerance test (OPTT). 2.5 g/kg pyruvate solution containing 40% [U-13C3]pyruvate was gavaged to KSPAPN mice after 1.5 months HFD dox600 feeding. Blood, liver and kidney were harvested at the 30-minute time point. We defined the carbon contribution of pyruvate to each metabolite by analyzing the amount and percentage of each metabolite that contains labeled carbons by mass spectrometry. Created with BioRender.com. B Blood glucose levels at 0, 15, 30-minute time point during OPTT (Control n = 8, KSPAPN n = 8). C Blood lactate levels at 0, 15, 30-minute time point during OPTT (Control n = 9, KSPAPN n = 8). D Tissue concentration of lactate and pyruvate in KSPAPN normalized to Control at 30-minute time point (Control n = 9, KSPAPN n = 8). E–F Mass isotopomer distribution (MID) of (E) blood pyruvate (with representative 40% enrichment of gavaged pyruvate) (Control n = 9, KSPAPN n = 8) and (F) blood lactate. M0 omitted for clarity of presentation (Control n = 9, KSPAPN n = 8). G Fractional contribution (FC) of gavaged pyruvate (40% tracer labeling in gavage solution) to blood lactate in control and KSPAPN plasma 30 minutes after the [U-13C3]pyruvate gavage FCLactate←Gavaged Pyruvate = [APELactate]/[APEGavaged Pyruvate]. (Control n = 9, KSPAPN n = 8). H Tissue concentration of metabolites in KSPAPN normalized to Control at 30-minute time point (Control n = 9, KSPAPN n = 8). I MID of blood glucose (carbons 4–6), M0 omitted for clarity of presentation (Control n = 9, KSPAPN n = 8). J The fractional contribution of gavaged-pyruvate, endogenous pyruvate and other carbon sources to the blood glucose (Control n = 9, KSPAPN n = 8). Data are mean ± SEM. Two-tailed unpaired Student’s t test was used from (D) to (J). ANOVA with 2-stage linear step-up procedure of BKY correction for multiple comparisons was performed to determine p-values for (B) and (C).

