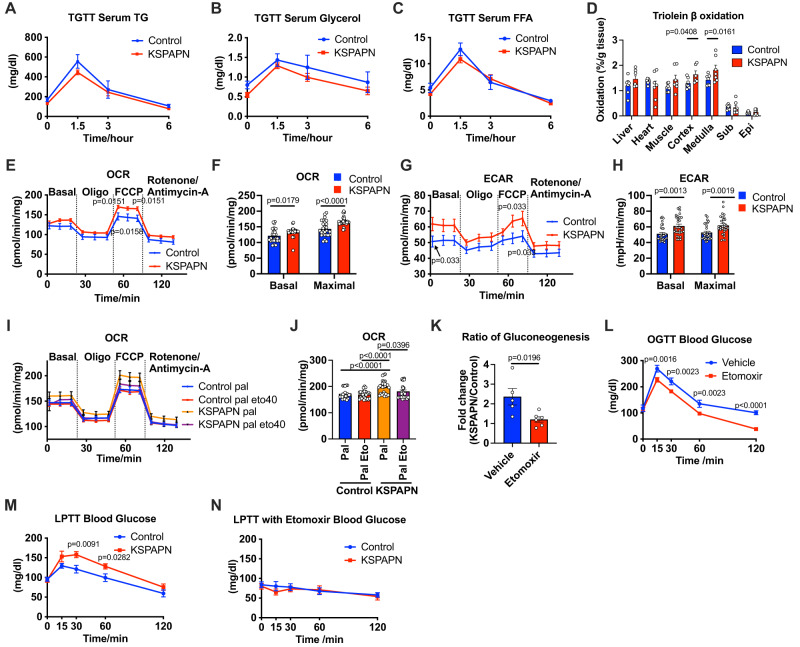
Fig. 5. Renal lipid metabolism enhances renal gluconeogenesis.
A Blood TG level at different time point during TG clearance test (Control n = 6, KSPAPN n = 11). B Blood glycerol level at different time point during TG clearance test (Control n = 6, KSPAPN n = 11). C Blood-free fatty acid level at different time points during the TG clearance test (Control n = 6, KSPAPN n = 11). D 3H-triolein lipid oxidation in tissues, including cortex and medulla, under chow diet conditions (Control n = 7, KSPAPN n = 7). Multiple unpaired two-tailed t-tests with 2-stage linear step-up procedure of BKY correction for multiple comparisons were performed to determine p-values E and F Oxygen consumption rate (OCR) of KSPAPN kidney tissues at basal level and after oligomycin (Oligo), FCCP and rotenone/antimycin-A treatment (Control n = 9, KSPAPN n = 10). G and H Extracellular acidification rate (ECAR) of kidney tissues at basal level, Oligo, FCCP and rotenone/antimycin-A treatment (Control n = 9, KSPAPN n = 10). I and J OCR of KSPAPN kidney tissue in the presence of palmitate with or without etomoxir. (Control pal n = 9, Control pal eto40 n = 10, KSPAPN pal n = 9, KSPAPN pal eto40 n = 9) 1-way ANOVA with 2-stage linear step-up procedure of BKY correction for multiple comparisons were performed to determine p-values for (J). K The ratio of glucose production from primary cultured KSPAPN kidney cortex cells with or without etomoxir treatment (Control n = 5, KSPAPN n = 6). Unpaired two-tailed student’s t-test was performed for statistics. L Blood glucose levels during an OGTT upon 20 mg/kg bodyweight etomoxir treatment (Vehicle n = 8, Etomoxir n = 7). M Blood glucose level in Lactate/pyruvate tolerance test in KSPAPN mice (Control n = 11, KSPAPN n = 10). N Blood glucose levels during a lactate/pyruvate tolerance test in KSPAPN mice (Control n = 9, KSPAPN n = 10). Data are mean ± SEM. 2-way ANOVA with 2-stage linear step-up procedure of BKY correction for multiple comparisons were performed to determine p-values for (E), (F), (G), (H), (L) and (M).

