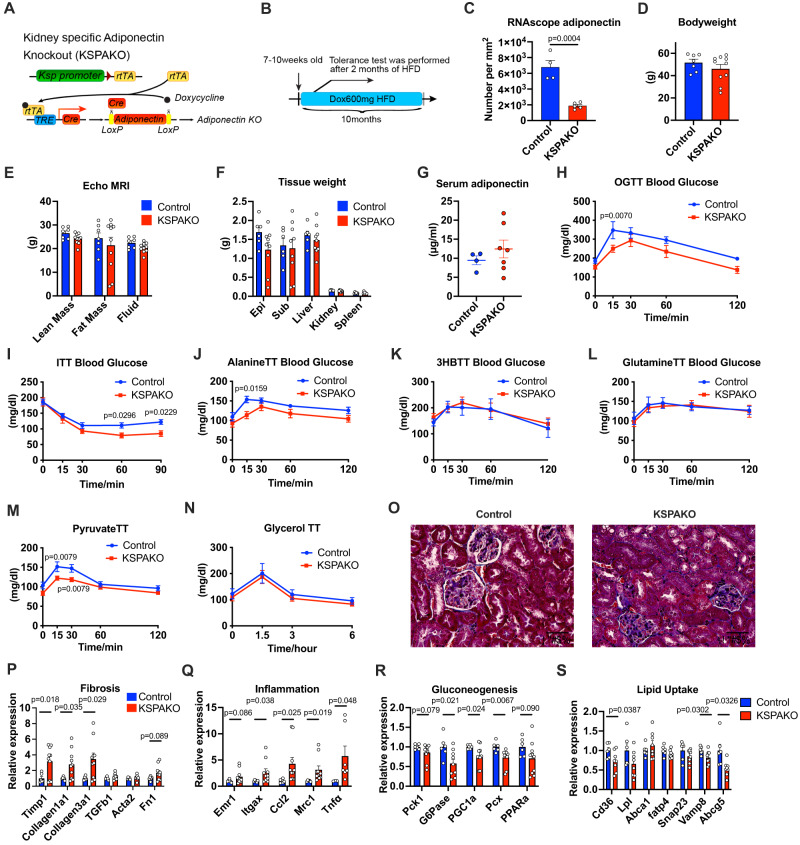
Fig. 6. Renal adiponectin KO mice exhibit an impaired gluconeogenic phenotype.
A Schematic illustration of the kidney-specific, doxycycline-inducible Adiponectin KO mouse model (KSPAKO). In this mouse model, KsprtTA expresses a rtTA specifically in kidney tubular cells. In the presence of Dox, rtTA activates the transcription of the TRE-Cre transgene. The Cre recombinase in turn clips the LoxP sites and converts the locus to the KO alleles. B Schematic representation of the time course of the experiment. Tolerance tests were performed 2 months after the start of HFD. Tissues were harvested after 10 months of HFD feeding. C Quantitation of adiponectin RNAscope signal in kidney tissues per mm2 (Control n = 4, KSPAKO n = 5). D Bodyweight of KSPAKO mice after 10 months of HFD dox600 (Control n = 7, KSPAKO n = 10). E Body composition measured by echo MRI (Control n = 7, KSPAKO n = 10). F Tissue weights of KSPAKO mice after 10 months of HFD dox600 (Control n = 6, KSPAKO n = 9). G Serum adiponectin levels in KSPAKO mice (Control n = 4, KSPAKO n = 7). H Blood Glucose levels at different time points during an OGTT (Control n = 7, KSPAKO n = 9). I Blood Glucose levels at different time points in ITT (Control n = 15, KSPAKO n = 12). J Blood glucose levels at different time points during an alanine tolerance test (Control n = 7, KSPAKO n = 10). K Blood glucose levels at different time points during a 3-hydroxybutyrate (3HB) tolerance test (Control n = 7, KSPAKO n = 10). L Blood glucose levels at different time points during a glutamine tolerance test (Control n = 7, KSPAKO n = 10). M Blood glucose levels at different time points during a pyruvate tolerance test (Control n = 10, KSPAKO n = 11). N Blood glucose levels at different time points during a glycerol tolerance test (Control n = 7, KSPAKO n = 10). O Representative trichrome staining images of the kidney. (Scale bar: 50 μm). P Gene expression of fibrosis markers (Control n = 6, KSPAKO n = 10). (Control n = 5, KSPAKO n = 10 for Acta2). Q Gene expression analysis of inflammation markers (Control n = 6, KSPAKO n = 10), (Control n = 3, KSPAKO n = 7 for Tnfα), (Control n = 5, KSPAKO n = 10 for Mrc1). R Gene expression analysis of gluconeogenesis markers (Control n = 6, KSPAKO n = 10), (Control n = 6, KSPAKO n = 10 for G6Pase). S Gene expression analysis of lipid uptake markers (Control n = 6, KSPAKO n = 8). Data are mean ± SEM. 2-way ANOVA with 2-stage linear step-up procedure of BKY correction for multiple comparisons were performed to determine p-values for (H), (I), (J) and (M). Multiple unpaired two-tailed t-tests with 2-stage linear step-up procedure of BKY correction for multiple comparisons were performed to determine p-values for (P), (Q), (R) and (S).

