Fig. 1.
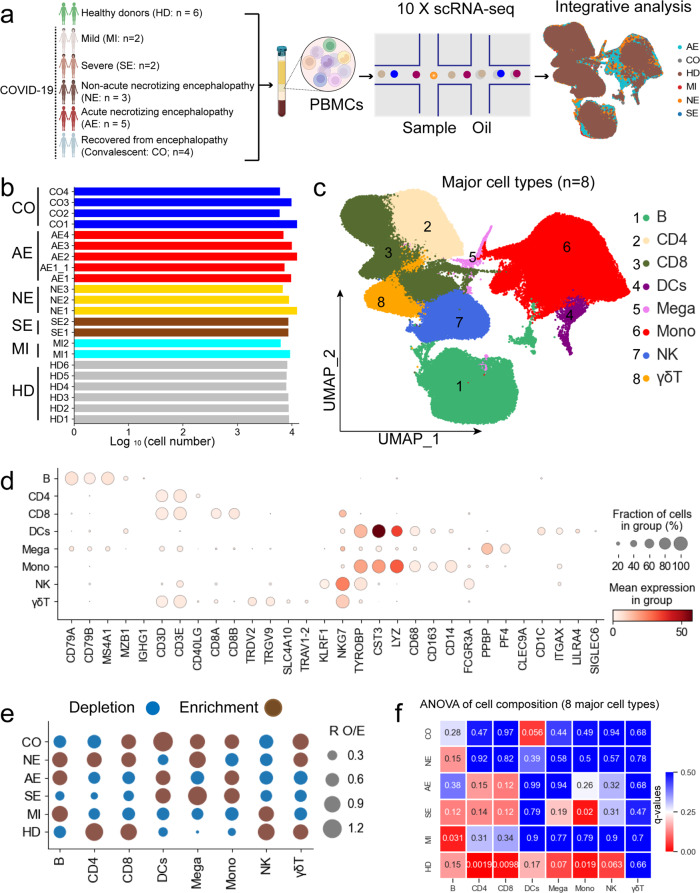
PBMC single-cell transcriptomic study design and overview of results. a Diagram depicting the overall study design. 22 samples were collected from 17 individuals, including 6 healthy donors and 11 COVID-19 patients (2 patients with mild-moderate disease, 2 patients with severe disease, 3 patients with non-acute necrotizing encephalopathy and 4 patients with acute necrotizing encephalopathy). b Box plots illustrating the log10 transformed number of cells for each sample. 6 HD samples were obtained from healthy donors, 2 MI samples from patients with mild-moderate symptoms, 2 SE samples from patients with severe symptoms, 3 NE samples from patients with non-acute necrotizing encephalopathy, 5 AE samples from patients with acute necrotizing encephalopathy and 4 CO samples from patients who recovered from encephalopathy (convalescent). c The clustering result (Left row) of 8 major cell types (right row) from 22 samples. Each point represents one single cell, colored according to cell type. d Dot plots of the 8 major cell types (Columns) and their marker genes (Rows). e Disease preference of major cell clusters as estimated using RO/E. f Heatmap showing the association between cell composition and disease types. The color represents ANOVA q-values

