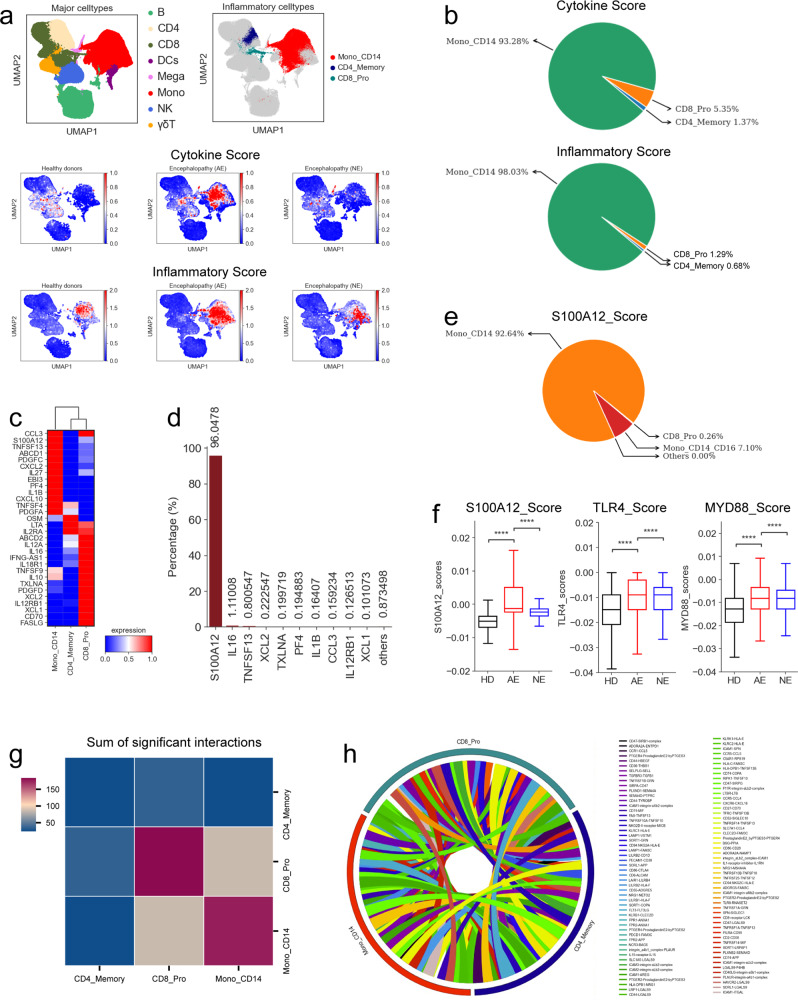
Fig. 3.
Contribution of S100A12 to COVID-19 cytokine storms in severe disease. a UMAP projections of PBMCs. Colored based on the 8 major cell types (top left), 3 hyper-inflammatory cell subtypes (top right), cytokine (Middle) and inflammatory score (Bottom). b Pie charts depicting the relative contribution of each inflammatory cell subtype to the cytokine and inflammatory scores. c Heatmap depicting the expression of cytokines within each hyper-inflammatory cell subtype identified. d Bar chart depicting the relative contribution of the top 10 cytokines in COVID-19 patients with acute necrotizing encephalopathy. e Pie charts depicting the relative contribution of each cell subtype to the S100A12-score. f Box plots depicting the S100A12, TLR4 and MYD88 gene expression scores between different groups. Significant differences were determined with a two-sided Student’s T-test with Bonferroni correction. Standard Error (SE) and median are shown. g Heatmap of the sum of significant interaction among the 3 hyper-inflammatory cell subtypes. h Circos plot depicting the ligand-receptor pair interactions between the 3 hyper-inflammatory cell subtypes

