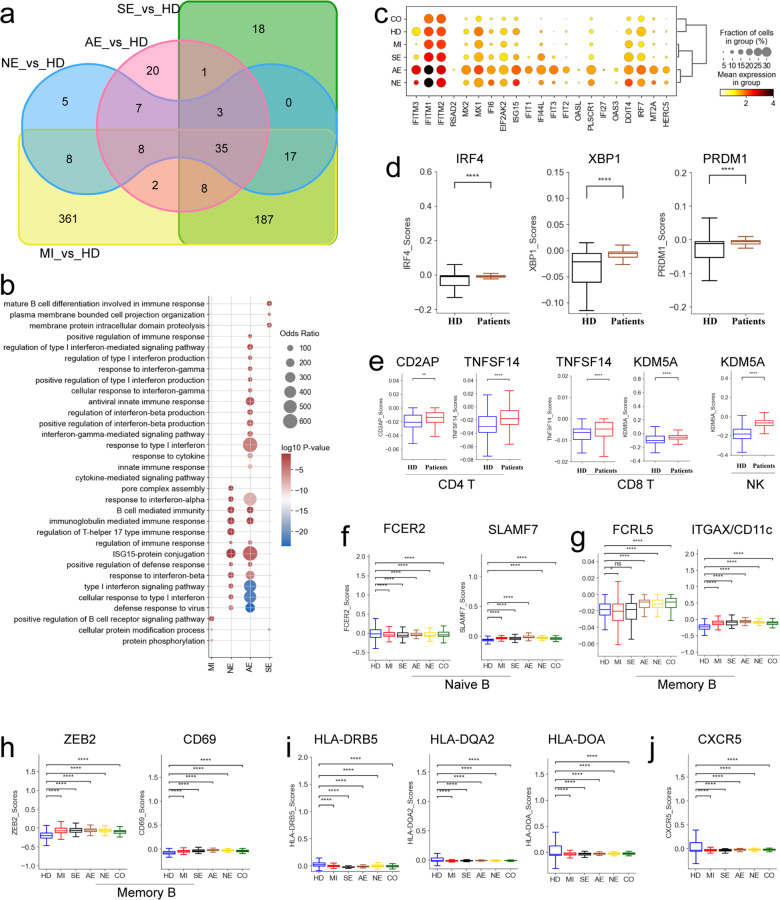
Fig. 5.
Gene expression differences in B cells from different COVID-19 groups. a Venn diagram shows number of upregulated DEGs in B cells, comparisons as indicated. b Selected enriched GO BP terms for genes upregulated in B cells. The colored bars show Log10 P-value. c Dot plots of selected IFN-response genes in B cells between groups. d Box plots of the selected genes in B cells between COVID-19 patients and healthy donors. e Box plots of selected genes in CD4 (Left), CD8 (Middle) and NK (Right) cells between COVID-19 patients and healthy donors. f Box plots depicting selected genes expressed in naïve B cells from different groups. g Box plots depicting selected genes expressed in memory B cells from different groups. h Box plots depicting ZEB2 and CD69 gene expression in memory B cells from different groups. i Box plots depicting HLA-II gene expression in B cells from different groups. j Box plots depicting CXCR5 expression in B cells from different groups. Significant differences in d, e, f, g, h, i and j were determined with a two-sided Student’s T-test with Bonferroni correction. Standard Error (SE) and median are shown

