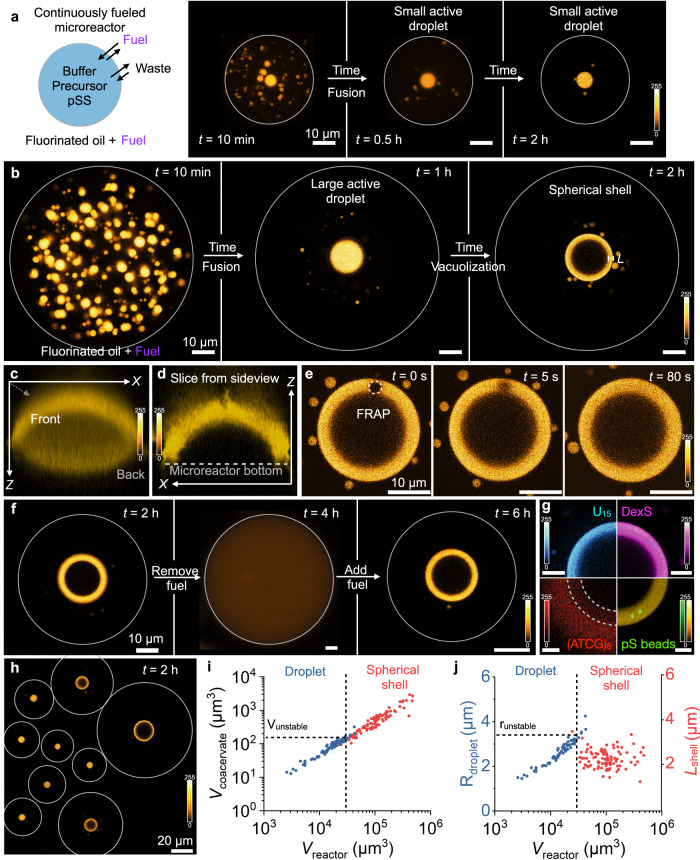
Fig. 3. Spherical shells are a stable, non-equilibrium state.
a, b Experimental setup to form microreactors that continuously fuel active droplets. Surfactant-stabilized microfluidic droplets (microreactors, grey outline) containing 10 mM precursor, 5 mM pSS, and 0.1 µM sulforhodamine B in 200 mM MES buffer at pH 5.3 were embedded in a fluorinated oil which contained 0.5 M DIC (fuel) to sustain the microreactor at a fuel concentration of 8.4 mM. Time-lapsed micrographs of a small (a) and large (b) microreactor in a steady state. The grey circle represents the size of the microreactor. The images for 10 min and 0.5 h in a and the image for 10 min in b are Z-projections of the microreactor. All other images are from one Z-plane. The scale bar of all images represents 10 µm. The color scale is given next to the images. c, d A 3D projection of a spherical shell reconstructed from Z-stack imaging. A 3D projection of the average pixel intensity (c) and a slice in the XZ-plane through the middle of the spherical shell (d) is shown. e A FRAP study of the spherical shell demonstrates that the shell is liquid and dynamic. The scale bar of all images represents 10 µm. The color scale is given next to the images. f The microreactor was fueled with 0.5 M DIC in the oil phase. After the formation of spherical shells (2 h), the oil phase was replaced with oil containing no DIC. After a homogenous solution was obtained (4 h), the oil was replaced with 0.5 M DIC-containing oil. The grey circle represents the size of the microreactor. The scale bar of all images represents 10 µm. The color scale is given next to the images. g Partitioning of different fluorescently labeled molecules into the spherical shell. The dotted line represents the outlines of the spherical shell. The scale bar of all images represents 5 µm. The color scale is given next to the images. h A macroscopic view of multiple microreactors shows that large reactors formed spherical shells while small microreactors contained droplets. The center Z-plane of each of the individual droplets and shells is projected. The grey circles represent the individual microfluidic reactors. The color scale is given next to the images. i The volume of the total coacervate material is shown for every individual microreactor that contained an active droplet (blue) or an active shell (red). Above a critical reactor volume, active droplets with a volume bigger than Vunstable transformed into spherical shells. j The radius of the active droplet (blue) and the shell thickness L of the active shell (red) for every individual microreactor is shown. Spherical shells had a similar thickness Lshell, which was within the range of runstable. All experiments were performed in triplicate (N = 3). Source data are provided as a Source Data file.

