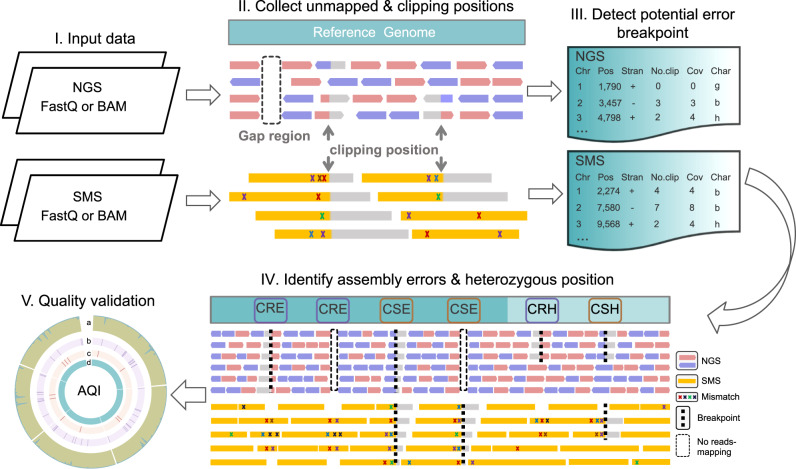
Fig. 1. An overview of CRAQ processing steps.
(I) The original next-generation sequencing (NGS) short reads and single molecule sequencing (SMS) long reads are separately mapped to the assembly and the resulting two alignment files are generated after filtering out low-quality reads. (II) Regions with no NGS reads mapped (i.e., gaps) and the positions where NGS/SMS reads are clipped are recorded. The number of clipped reads and the total read coverage at each position are also recorded. (III) For clipped positions from the NGS and SMS alignment, we define heterozygous loci (suffix “h”) and the mapping breakpoints (suffix “b”) based on a user-defined cutoff for the ratio of the number of clipped reads to the total reads mapped at that position. Together with gaps (suffix “g”), such breakpoints are defined as locations of putative assembly errors. (IV) Putative errors are further classified as Clip-based Regional Errors (CREs) or Clip-based Structural Errors (CSEs) based on read-mapping status. CREs are defined as those with NGS breakpoints or gaps spanned by SMS long reads but enriched in base mismatches; CSEs are defined as those with SMS clipping breakpoints near the NGS breakpoint or gap region. Heterozygous regions are also classified as Clip-based Regional Heterozygosity (CRH) or Clip-based Structural Heterozygosity (CSH) regions based on similar criteria but considering the ratio of mapping coverage. (V) Identified CREs and CSEs are visualized and further used in benchmarking the genome assembly quality. CRAQ outputs a whole-genome summary, regional AQI scores (track a), and the precise location of CREs (track b) and CSEs (track c) for each assembly fragment (track d).

