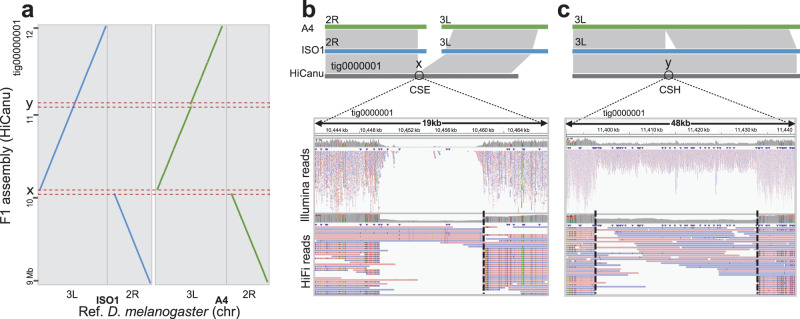
Fig. 2. Identification of heterozygous loci and true assembly errors.
a Example of a syntenic comparison by NUCmer between the HiCanu assembly of a D. melanogaster F1 individual and the corresponding chromosomes of the two parental strains (paternal, ISO1; maternal, A4). Track x and y on the y-axis represent regions associated with two clipped positions in the HiCanu assembly. Region x and region y were identified by CRAQ as a CSE (b) and a CSH (c), respectively. The top panel of each graph displays local alignments between the HiCanu contig and references. The bottom panel shows the read mapping status within the CSE (a structural contig misjoin) and the CSH (a heterozygous variant of ~35 kb). The mapping breakpoints are marked with gray dashed lines.

