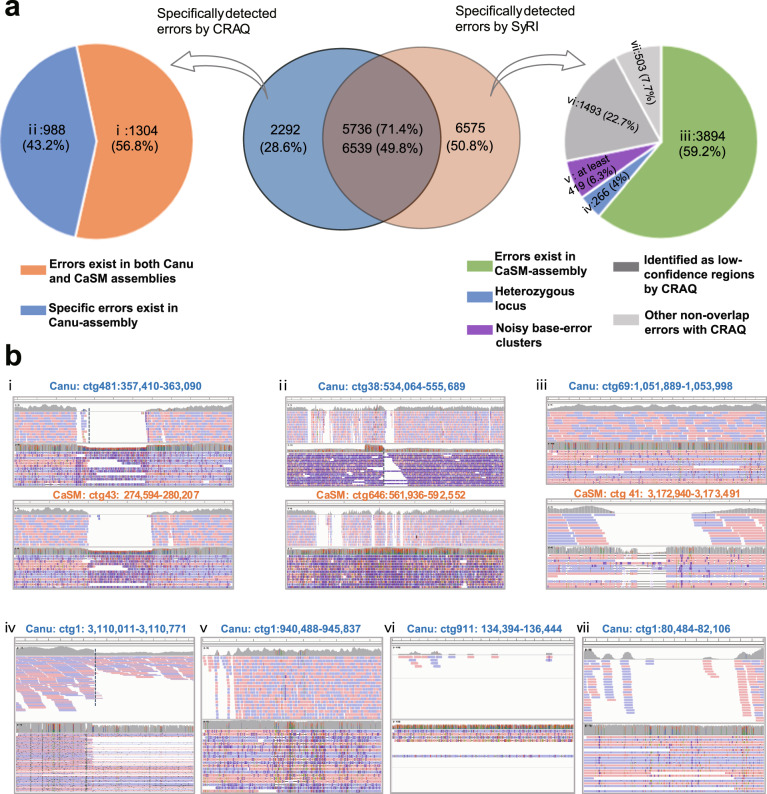
Fig. 3. Comparison of errors detected with CRAQ and SyRI in selected S. pennellii assemblies.
a Distribution of error types among unique and overlapping errors identified with CRAQ and SyRI. If a SyRI-SV locus fell in a CRE/CSE region, we classified the two errors as the same error. Each category of specific errors identified with CRAQ or SyRI was labeled from ‘i’ to ‘vii’, corresponding to data shown in b. b Examples of read mapping statuses for error regions of each category labeled in a. Pileup plots and coverage from Illumina and Nanopore reads are shown. For tracks ‘i’, ‘ii’ and ‘iii’ the upper panel shows a region in the Canu assembly and the lower panel shows the orthologous region in the CaSM assembly. The mapping breakpoints are marked with gray dashed lines.

