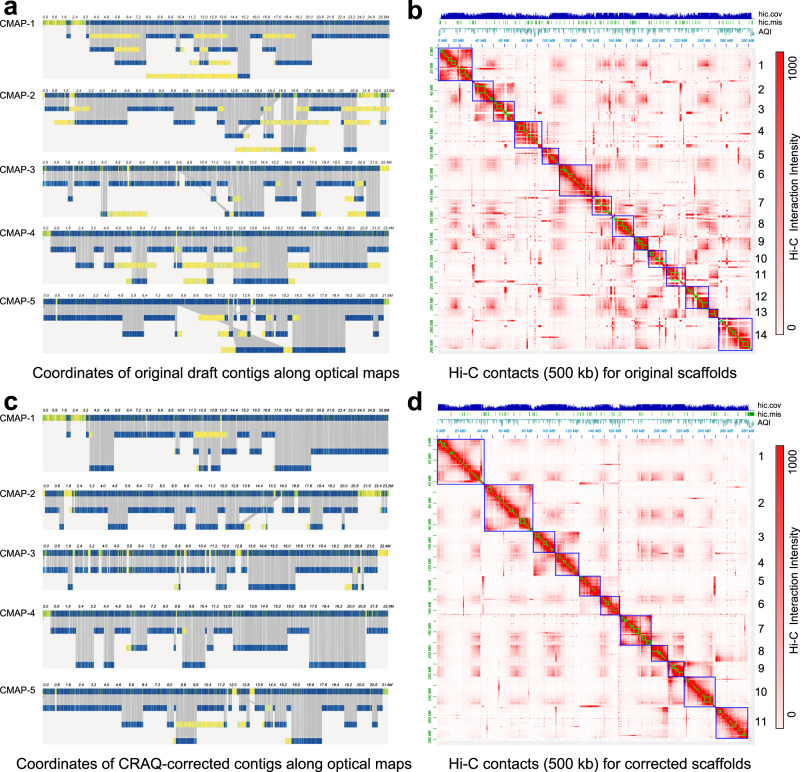
Fig. 5. Overview of optical mapping and Hi-C contacts before and after CRAQ correction.
a Alignment of in silico genomic maps, including draft contigs of A. oxysepala and the five largest Bionano DLE-1 maps. Collinear DLE-1 markers on the two maps are linked with gray lines. Regions in yellow exhibit breaks in collinearity between the two maps. b Hi-C contacts of the original scaffolds of A. oxysepala. The order of contigs and scaffolds are presented with green and blue squares, respectively, along the diagonal. The top tracks show the AQI (local AQI score), hic.cov, and hic.mis detected with 3D-DNA. c Alignment of in silico genomic maps, including CRAQ-corrected contigs and optical DLE-1 maps. d Hi-C contacts of the corrected scaffolds for A. oxysepala.

