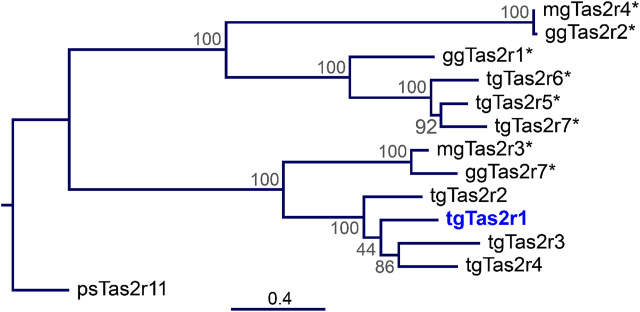
FIGURE 1.
Phylogenetic tree of zebra finch, chicken, and turkey Tas2r. The tree was generated by the Maximum-Likelihood method. The amino acid sequences of the 7 zebra finch bitter taste receptors (tgTas2r1-7), the 3 chicken Tas2rs (ggTas2r1, -r2, -r7), the 2 turkey Tas2rs (mgTas2r3 and –r4), and a turtle bitter taste receptor serving as outgroup (Tas2r11 from Pelodiscus sinensis) were aligned using MAFFT version 7. The scale bar at the bottom indicates the phylogenetic distance of peptide sequences. The node numbers represent branch support. Blue, Tas2r1 deorphaned here; asterisks, previously deorphaned Tas2rs.

