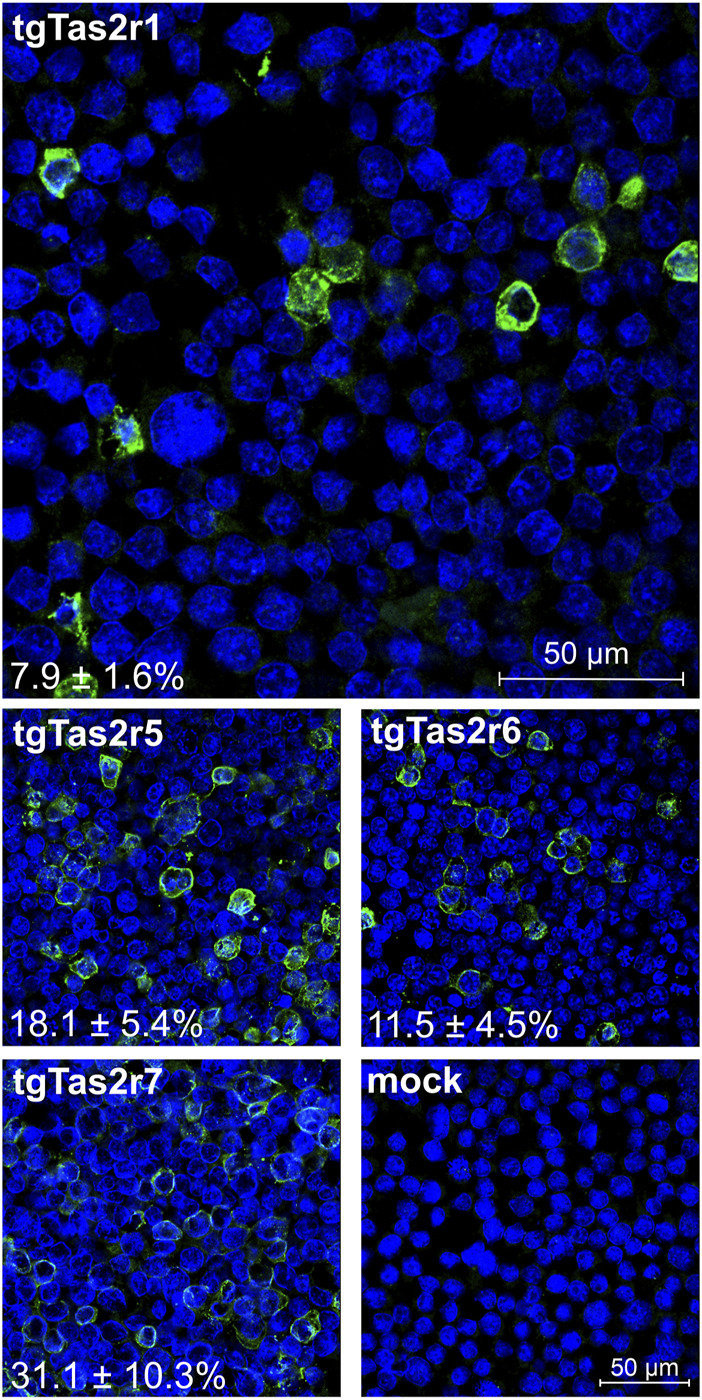
FIGURE 2.

Immunocytochemistry of tgTas2r expression after transient transfection. Expression of tgTas2r1 in Gα16gust44 cells was monitored by confocal laser scanning microscopy using an antiserum against the hsv-epitope attached to the receptor C-terminus (green) and DAPI to visualize nuclei (blue). For comparison also expression constructs coding for tgTas2r5, -r6, and –r7 were analyzed. The specificity of receptor detection is demonstrated by the lack of green signals in identically treated empty vector transfected cells (mock). The constructs used for transient transfection and the determined expression rates (in % ± SD) are labeled in the corresponding panels. The average expression rates were based on the counting of 479–521 cells (nuclei) from 3 representative images by 3 independent persons. Scale bars are shown in the upper and bottom right panels.
