FIGURE 4.
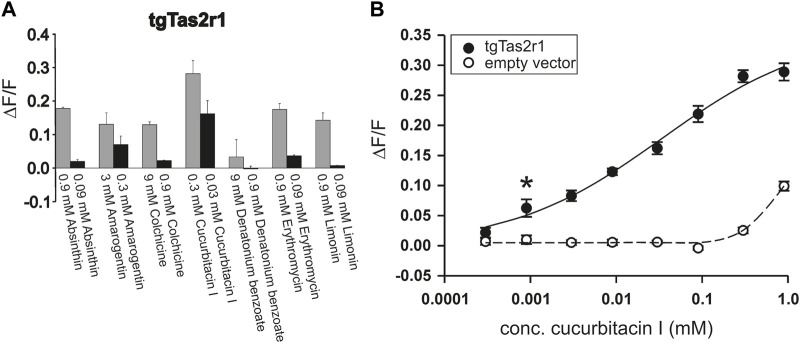
Functional screening of zebra finch bitter taste receptor tgTas2r1. tgTas2r1 was transiently transfected in HEK 293T-Gα16gust44 cells and screened with in total 72 natural and synthetic bitter compounds by calcium imaging. (A) Each compound resulting in the stimulation of a tgTas2r1 in a prescreening was tested in two different concentrations. The responses upon stimulation with the maximal concentration not leading to unspecific cellular responses, are shown by gray bars. The black bar representing lower concentration of compounds (1:10 dilution). The y-axis shows the relative fluorescence changes (∆F/F ± SD), and the x-axis is labeled with activating bitter compounds. (B) Dose-response relationship of tgTas2r1 with cucurbitacin I. The data are derived from two independent experiments each performed with 8 technical replicates for each concentration of receptor transfected and 4 corresponding technical replicates for empty vector transfected cells. The relative changes in fluorescence of receptor expressing cells (ΔF/F ± SEM, black circles, solid line) did not show clear signal saturation at concentrations (≤0.3 mM) with absent or tolerable receptor-independent artefact signals (cf. empty vector control, open circles, broken line). The asterisk indicates the threshold concentration defined as the lowest concentration at which receptor-transfected cells show a significant higher signal (p < 0.05) than empty vector transfected cells.

