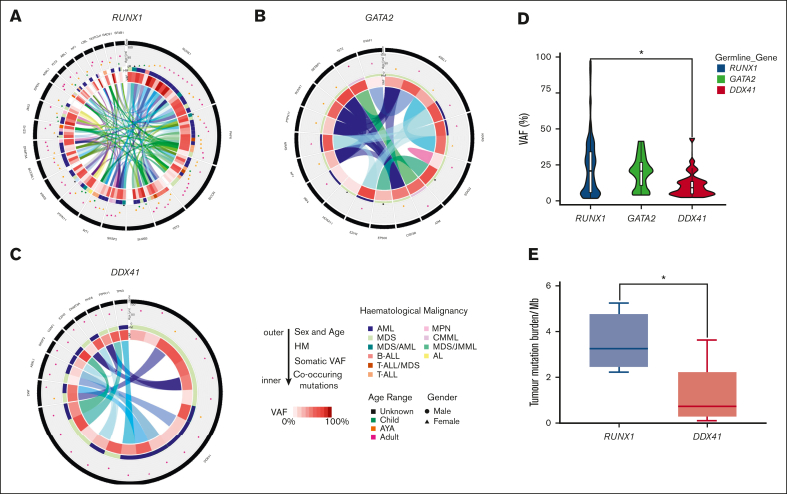
Figure 5.
Clinically relevant somatic variants identified in the germ line carriers-with HM cohorts. Distribution of the clinically relevant somatic variants, driver somatic variants, identified in the carriers-with HM cohorts. From outside to inside: 1. Gene with the somatic variant. The length of the black bar indicates the frequency of variant within the germ line carriers-with HM cohort. 2. The age and sex of the individual with the somatic variant. Triangle = female, circle = male. Age groups are indicated by colors (green = child [≤14 years], orange = AYA [15-39 years], adult = pink [≥40 years], black = the age of the individual is unknown). 3. The type of HM is indicated by the color of the bar. 4. VAF of the somatic variant in the sample as represented on a sliding scale (darker = high VAF, lighter = low VAF). 5. The inner ring depicts the association of different somatic variants in the sample. The colored ribbon depicts a unique sample and the associated somatic variants observed in the sample. (A) Germ line RUNX1 carriers-with HM cohort. Only shown are the genes that are identified as somatically mutated in 2 or more individuals. (B) Germ line GATA2 carriers-with HM cohort, showing all driver somatic variants and (C) Germ line DDX41 carriers-with HM cohort showing all driver somatic variants. (D) Violin plot displaying the distribution of driver somatic variant VAFs observed in the germ line carriers-with HM cohorts. Boxes represent the 25th and 75th percentiles, with the horizontal line in the middle indicating the median, and the vertical lines representing the 95th percentile cohorts. ∗P < .05, 1-way analysis of variance of log-transformed values, with Tukey multiple comparison test. (E) TMB in germ line RUNX1 and DDX41 carriers-with HM cohorts. TMB is the number of SNV and INDELs divided by 38Mb coding region. Only malignancy samples where we had available a matched germ line control tissue were used for analysis. Boxes represent the 25th and 75th percentiles, with the horizontal line in the middle indicating the median, and the vertical lines representing the max and min values. ∗P < .05 nonparametric Mann-Whitney U test. AYA, adolescents and young adults; AML, acute myeloid leukemia; AL, acute leukemia; B-ALL, B-cell acute lymphoblastic leukemia; CML, chronic myeloid leukemia; CMML, chronic myelomonocytic leukemia; JMML, juvenile myelomonocytic leukemia; MPN, myeloproliferative neoplasms; T-ALL, T-cell acute lymphoblastic leukemia.

