
Figure 3.
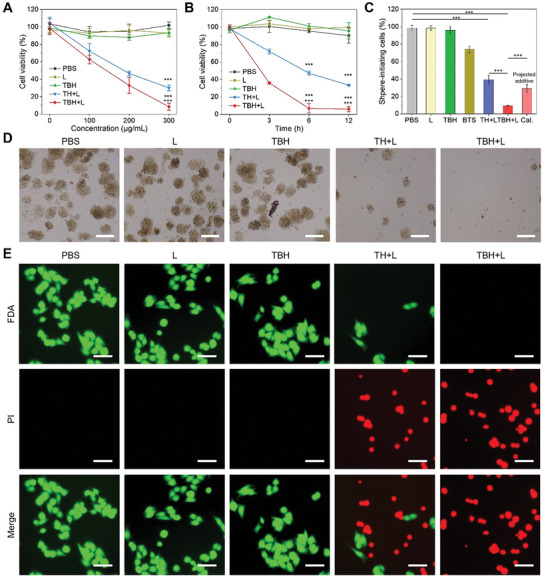
A) The cell viability of mixture 4T1 CSC and nCSC treated with PBS or two hydrogels containing different loading concentrations of TDCAc. B) The cell viability of mixture 4T1 CSC and nCSC treated with different formulations under different incubation times. C) The percentage of CSC tumor spheres after various treatments. The projected additive value is calculated by multiplying the surviving fraction of cells from the independent BTS treatment and the surviving fraction of the TH+L treatment. D) Sphere‐formation assays using 4T1 CSC cultured with various treatments. Scale bars: 100 µm. E) Live/dead cell staining of 4T1 cells after various treatments, live cells were stained with green fluorescent FDA and dead cells were stained with red fluorescent PI. Scale bar: 60 µm. The concentration of TDCAc and BTS in the final prepared TBH or TH gel is 100 µg mL−1 and 10 µg mL−1, respectively. The applied parameter of 660 nm laser irradiation is 0.5 W cm−2 for 5 min. Data are presented by mean ± SD, n = 3, **p< 0.01, ***p< 0.001 as compared with the controlled group, ++p< 0.01, +++p< 0.001 as compared with the “TH+L” group.