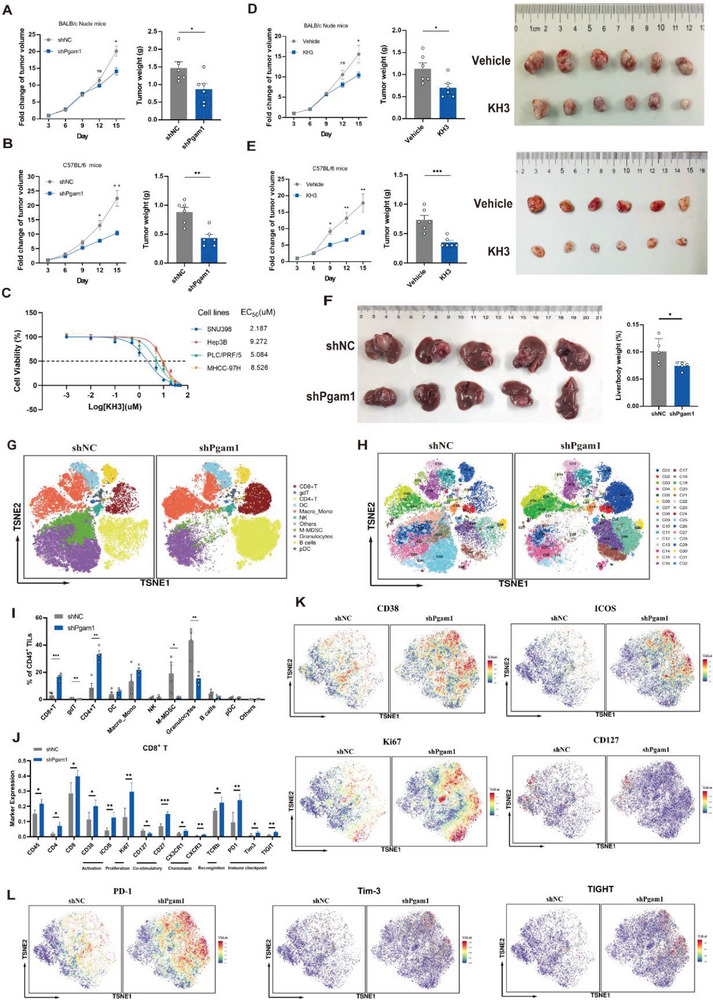
Figure 2.

Targeting PGAM1 inhibits HCC progression and favors the antitumor immune response by reshaping the immune microenvironment in HCC. A,B) Tumor growth curve and tumor weight in immunodeficient nude mice (A) or immunocompetent C57BL/6 mice (B) with subcutaneous inoculation of shNC or shPgam1 Hepa16 cells (n = 6 per group). C) EC50 curve of KH3 suppressing the proliferation of 4 human HCC cell lines. D,E) Tumor growth curve, tumor weight, and tumor image in immunodeficient nude mice (D) or immunocompetent C57BL/6 mice (E) with subcutaneous inoculation of Hepa16 cells treated with vehicle (PLGA) or KH3 (n = 6 per group). F) Final images, liver weight, and liver/body weight (%) of C57BL/6 mice bearing orthotopic shNC and shPgam1 Hepa16 tumors. G,H) The t‐SNE plot of major immune cell types (G) and 32 immune subsets (H) within CD45+ tumor‐infiltrating leukocytes of shNC or shPgam1 orthotopic Hepa16 tumors by mass cytometry (CyTOF) (n = 5 per group). I) Histogram for the frequencies of major immune cell types within the CD45+ population of shNC and shPgam1 Hepa16 orthotopic tumors. J) Histogram for the expression of significantly altered markers of the CD8+ T population between shNC and shPgam1 Hepa16 orthotopic tumors. K) Density t‐SNE plot for the expression of activation markers (CD38 and ICOS), proliferation markers (Ki67), and co‐stimulatory markers (CD127) in infiltrated CD8+ T‐cell within the CD45+ population of shNC and shPgam1 Hepa16 orthotopic tumors by CyTOF analysis. L) Density t‐SNE plot for the expression of immune checkpoints (PD‐1, Tim‐3, and TIGHT) in infiltrated CD8+ T‐cell within the CD45+ population of shNC and shPgam1 Hepa16 orthotopic tumors by CyTOF analysis. The data were presented as the means ± SD and p values were determined by a two‐tailed unpaired t‐test.
