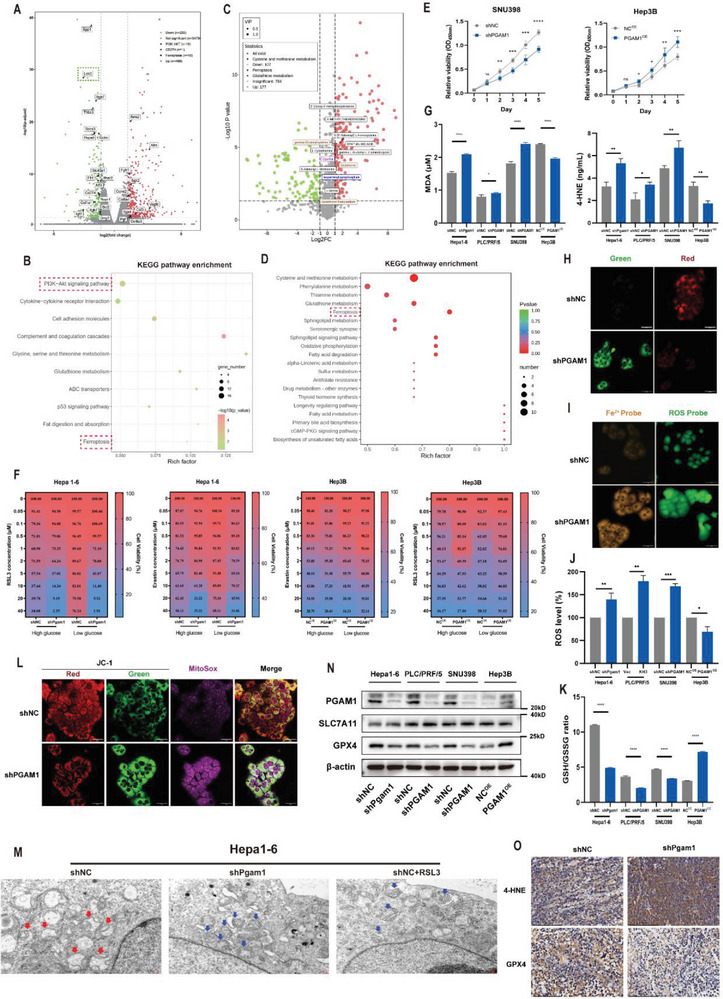
Figure 3.

PGAM1 inhibition enhances ferroptosis in HCC cells. A) Volcano plot of RNA data for shNC and shPgam1 Hepa16 cells. A total of 691 significant DEGs was detected by using “DESeq2” package, including 469 upregulated genes and 222 downregulated genes. B) KEGG analysis for the identification of PGAM1‐mediated downstream pathways based on the DEG analysis result of Hepa16 cells. C) Volcano plot of metabonomic data for shNC and shPgam1 Hepa16 cells. D) KEGG analysis for the identification of PGAM1‐mediated downstream pathways based on the differential metabolites analysis result of Hepa16 cells. E) Cell viability changes (CCK‐8 assays) of PGAM1‐silencing SNU398 and PGAM1 overexpressed Hep3B cell line over 4 days. F) Heatmap demonstrated targeting PGAM1 enhanced the sensitivity to two ferroptosis inducers (RSL3, Erastin) in Hepa16 and Hep3B cell lines under high glucose and low glucose media. G) The concentration of MDA and 4‐HNE were detected in PGAM1‐silencing Hepa16, PLC/PRF/5, SNU398 cell lines, and PGAM1 overexpressed Hep3B cell line. The protein concentration of each cellular lysis was titrated to 500ug ul−1. H) BODIPY 581/591 C11 (a marker of lipid peroxidation) fluorescent probe showing increased lipid peroxidation accumulation in PLC/PRF/5 cells with shPGAM1 (Scale bar = 50 µm). I) FerroOrange and ROS probe exhibiting increased intracellular Fe2+ levels and ROS levels in PLC/PRF/5 cells with shPGAM1 (Scale bar = 50 µm). J,K) Quantitation of ROS levels and GSG/GSSG ratio were detected in PGAM1‐silencing Hepa1‐6, PLC/PRF/5, SNU398 cell lines, and PGAM1 overexpressed Hep3B cell line. The protein concentration of each cellular lysis was titrated to 500ug ul−1. L) JC‐1 detections with mitoSOX staining comprehensively showing ROS accumulation and reduced membrane potential in mitochondria in PLC/PRF/5 cells with shPGAM1 (Scale bar = 50 µm). M) TEM imaging was conducted in shNC and shPgam1 Hepa16 cells. Hepa16 cells treated with RSL3 (2 µmol L−1) functioned as the positive control. Red arrows showed the morphology of normal mitochondria in shNC Hepa16 cells. Blue arrows showed the shrunk mitochondria in shPgam1 Hepa16 cells and positive control (Scale bar = 2 µm). N) Western blot showing the expression of SLC7A11 and GPX4 in the indicated four modified HCC cell lines. O) IHC examining the level of 4‐HNE and the expression of GPX4 in mouse subcutaneous tumor tissues of Hepa16 cells with shNC or shPgam1 (Scale bar = 100 µm). The data were presented as the means ± SD of three independent experiments or triplicates. p values were determined by a two‐tailed unpaired t‐test. * p < 0.05; ** p < 0.01; *** p < 0.001; **** p < 0.0001; n.s., not significant, p > 0.05.
