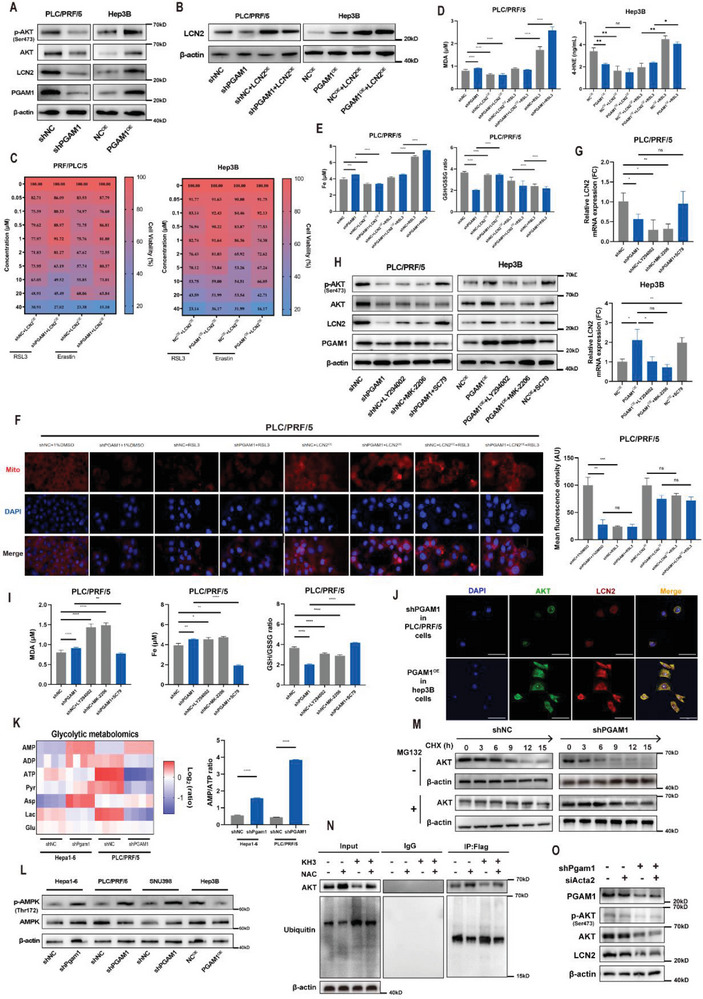
Figure 4.

Targeting PGAM1 suppresses LCN2 expression via energy stress/ROS‐dependent inhibition of AKT. A) Western blot detected the protein expression of PGAM1, LCN2, AKT, p‐AKT in indicated PLC/PRF/5 and Hep3B cell lines. B) Western blot validated the establishment of the above 2 HCC cell lines with recombinant LCN2 expression. C) Heatmap demonstrated recombinant LCN2 expression reversed the enhancement of ferroptosis sensitivity induced by PGAM1 inhibition in the above 2 HCC cell lines under high glucose condition. D) The intracellular concentration of MDA and 4‐HNE were detected in indicated PLC/PRF/5 or Hep3B cell lines treated with RSL3 (2 µm) in the presence or absence of recombinant LCN2 expression. The protein concentration of each cellular lysis was titrated to 500ug ul−1. E) Total iron and GSH/GSSG ratio were detected in indicated PLC/PRF/5 treated with RSL3 (2 µm) in the presence or absence of recombinant LCN2 expression. The protein concentration of each cellular lysis was titrated to 500ug ul−1. F) Mitochondrial membrane potential detection and statistics in indicated PLC/PRF/5 cells treated with RSL3 (2 µm) in the presence or absence of recombinant LCN2 expression (Scale bar = 50 µm). G) Relative mRNA expression of LCN2 in the above 2 HCC cell lines treated with LY294002 (15 µm), MK‐2206 (15 µm), or SC79 (15 µm). H) Western blot detected the protein expression of PGAM1, LCN2, AKT, p‐AKT in indicated PLC/PRF/5 and Hep3B cell lines treated with LY294002 (15 µm), MK‐2206 (15 µm) or SC79 (15 µm). I) The intracellular concentration of MDA, total iron, and GSH/GSSG ratio was detected in indicated PLC/PRF/5 cell lines treated with LY294002 (15 µm), MK‐2206 (15 µm) or SC79 (15 µm). J) IF staining exhibiting the expression characteristics and co‐localization of AKT and LCN2 in PGAM1 differentially expressed PLC/PRF/5 and Hep3B cells (Scale bar = 50 µm). K) Metabolic heatmap for several glycolytic intermediates and the AMP/ATP ratio in indicated Hepa16 and PLC/PRF/5 cell lines (n = 3 per group). L) Western blot detected the protein expression of AMPK and p‐AMPK in indicated Hepa16, PLC/PRF/5, SNU398, and Hep3B cell lines. M) Western blotting showing the effect of PGAM1 depletion on AKT stability in PLC/PRF/5 cells incubated with CHX or MG132 at the indicated time points. N) Co‐IP analyses were conducted to identify the function of KH3 (pharmacological PGAM1 inhibition) and NAC (ROS scavenger) on the AKT ubiquitination level in PLC/PRF/5 cells incubated with MG132. O) Western blotting showing the effect of PGAM1 depletion and/or ACTA2 depletion on the expression of p‐AKT, AKT, and LCN2 in PLC/PRF/5 cells. The data were presented as the means ± SD of three independent experiments or triplicates. p values were determined by a two‐tailed unpaired t‐test. * p < 0.05; ** p < 0.01; *** p < 0.001; **** p < 0.0001; n.s., not significant, p > 0.05.
