
Figure 5.
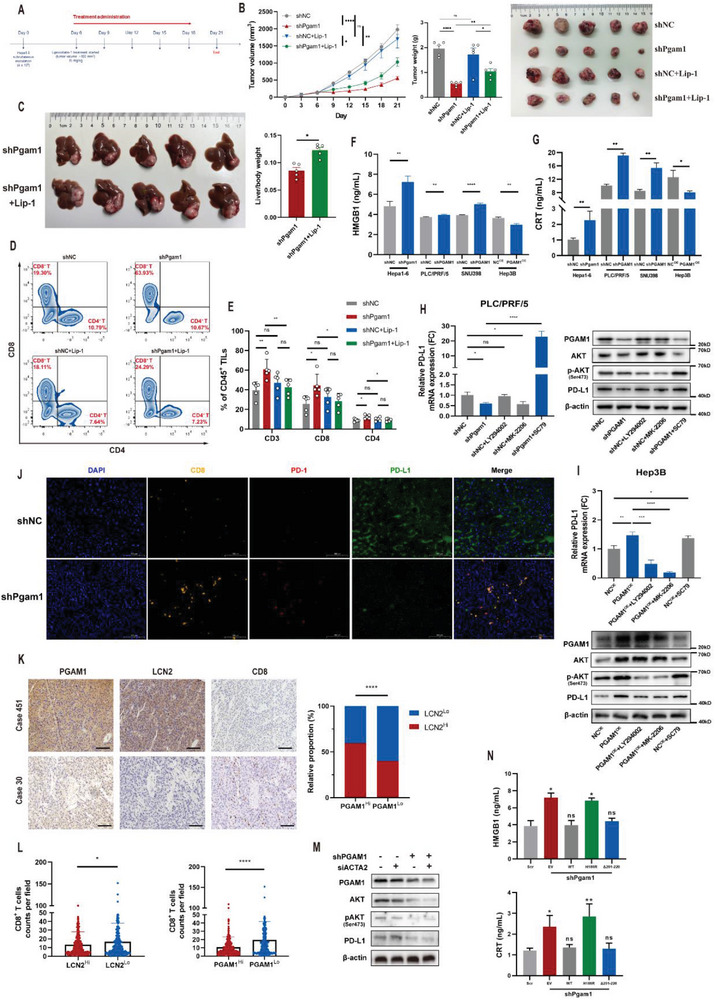
PGAM1 inhibition could promote CD8+ T‐cell infiltration and down‐regulate PD‐L1 in HCC. A) Liproxstatin‐1 treatment strategy of HCC growth inhibition in subcutaneous shNC and shPgam1 Hepa16 xenografts (n = 5 per group). Six days after shNC and shPgam1 Hepa16 cell inoculation, liproxstatin‐1 was intraperitoneally injected (15 mg kg−1) once every 3 days for 5 times. Mice were sacrificed on day 21. B) Tumor growth curves, tumor weight and tumor images of Hepa16 subcutaneous xenografts of ferroptosis inhibition experiment (n = 5 per group). C) Final images and liver/body weight (%) of C57BL/6 mice with orthotopic injection of shPgam1 Hepa16 cells and treated with Liproxstatin‐1 (n = 5 per group). D,E) Representative images and quantification of CD8+ tumor‐infiltrating leukocytes analyzed by flow cytometry for subcutaneous shNC and shPgam1 Hepa16 tumors treated with liproxstatin‐1 (n = 5 per group). F,G) Cellular supernatant of HMGB1 and CRT in four PGAM1‐modified HCC cell lines. H,I) Relative mRNA of PD‐L1 as well as protein expression of PGAM1, AKT, p‐AKT and PD‐L1 in indicated PLC/PRF/5 and Hep3B cells treated with LY294002 (15 µm), MK‐2206 (15 µm) or SC79 (15 µm); the mRNA expression of the other 4 groups were normalized according to the result of shNC. J) mIHC staining exhibiting the infiltration of CD8+ T‐cells, PD‐1and PD‐L1 expression of Hepa16 subcutaneous tumor in shNC and shPgam1 group (Scale bar = 100 µm). K) Representative IHC images of PGAM1, LCN2, CD8 expression and the relative proportion of LCN2Hi and LCN2Lo HCC tissues in PGAM1Hi and PGAM1Lo HCC tissues of Zhongshan TMA cohort (Scale bar = 200 µm). L) The CD8+ T‐cell counts per field (CD8+ T‐cell infiltration) is negatively associated with PGAM1 and LCN2 expression in HCC tissues of Zhongshan TMA cohort. M) Western blotting showing the effect of PGAM1 depletion and/or ACTA2 depletion on the expression of AKT, p‐AKT, and PD‐L1 in PLC/PRF/5 cells. N) Cellular supernatant of HMGB1 and CRT in Pgam1 stably depleted Hepa16 cells reconstituted with PGAM1 wildtype or indicated mutants. The data were presented as the means ± SD of three independent experiments or triplicates. p values were determined by a two‐tailed unpaired t‐test, * p < 0.05; ** p < 0.01; *** p < 0.001; **** p < 0.0001; n.s., not significant, p > 0.05.