
Figure 6.
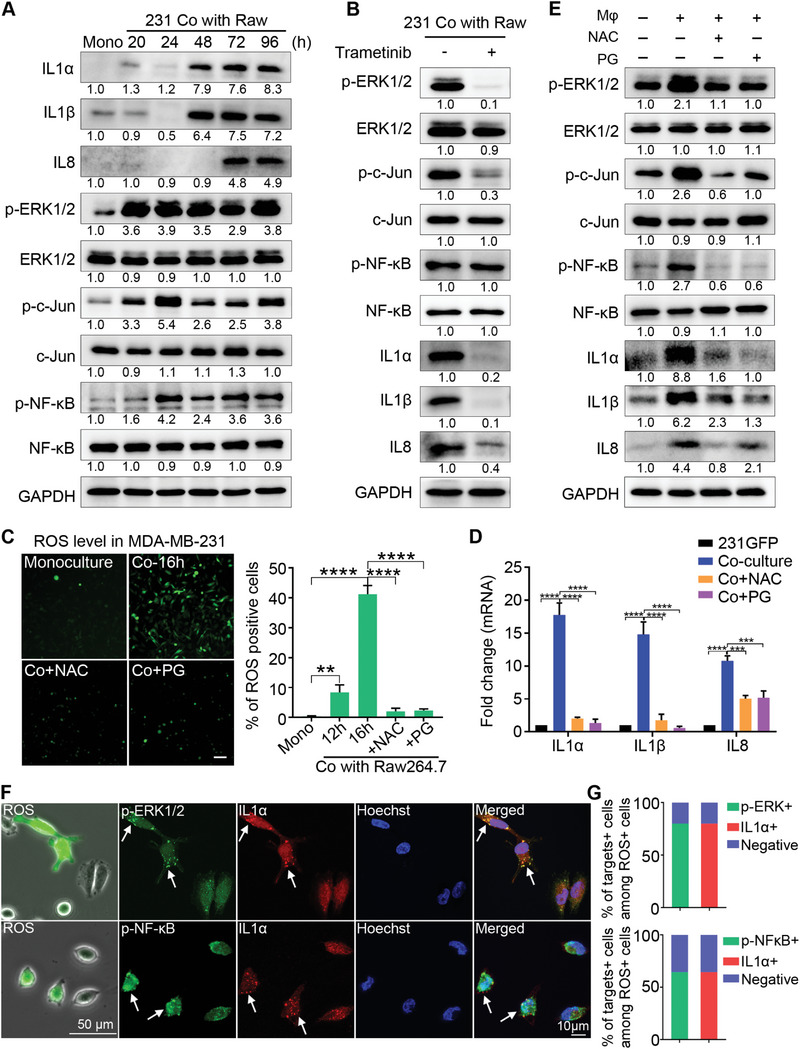
Co‐culturing induced ROS elevation and activated the ERK1/2‐c‐Jun and NF‐κB signaling pathways to upregulate the expression of IL1α, IL1β and IL8. A) Western blotting of the total or phosphorylated protein levels of IL1α, IL1β, IL8, ERK1/2, c‐Jun, and NF‐κB in the mono‐ or co‐cultured 231‐GFP cells with Raw264.7‐tdT. B) Western blotting of ERK1/2, p‐ERK1/2, c‐Jun, p‐c‐Jun, NF‐κB, p‐NF‐κB, IL1α, IL1β and IL8 in the 231‐GFP cells treated with or without the MEK inhibitor trametinib (10 nM) during 96 h of the co‐culture treatment with Raw264.7‐tdT. The medium containing the inhibitor was replaced every two days. C) (left) DCFDA‐stained fluorescence images of the mono‐ or 16 h co‐cultured MDA‐MB‐231 cells with Raw264.7, with or without the NAC (5 mM) and PG (20 µM) treatment. Scale bar, 100 µm. (right) Quantitative results of the percentage of ROS‐positive MDA‐MB‐231 cells. D) qPCR showing the mRNA levels of IL1α, IL1β and IL8 in the mono‐ or co‐cultured 231‐GFP cells with Raw264.7‐tdT, with or without the NAC (5 mM) and PG (20 µM) treatment during co‐culturing. E) Western blotting results showing the total or phosphorylated protein levels of ERK1/2, c‐Jun, NF‐κB, IL1α, IL1β and IL8 in the mono or co‐cultured 231‐GFP cells with or without NAC (5 mM) and PG (20 µM) during 96 h of the co‐culture treatment with Raw264.7‐tdT. F) Fluorescence and phase images of the MDA‐MB‐231 cells after 48 h of co‐culturing with Raw264.7 followed by DCFDA staining for ROS detection (left column). Scale bar, 50 µm. Representative co‐IF staining images of the distribution of p‐ERK1/2 and IL1α or p‐NF‐κB and IL1α in the same cells that were stained with DCFDA. Scale bar, 10 µm. G) Percentages of the cells stained with higher levels of both p‐ERK1/2 and IL1α or p‐NF‐κB and IL1α among the ROS‐positive MDA‐MB‐231 cells. (n = 50 cells). The results represent the means ± SD from three independent experiments. Significant differences were determined by one‐way ANOVA. **p < 0.01, ***p < 0.001 and ****p < 0.0001.