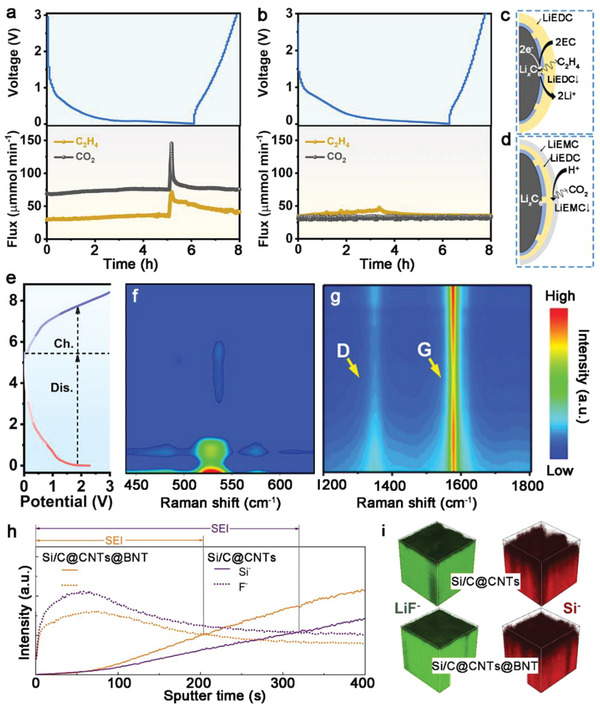
Figure 5.

Voltage profiles and in situ DEMS signals for a) Si/C@CNTs and b) Si/C@CNTs@BNT at 0.2 A g−1 of the initial charging/discharging process. Gas generation mechanism in batteries for c) C2H4 and d) CO2. e) Voltage profiles and f, g) in situ Raman spectroscopy of Si/C@CNTs@BNT anode in the range of (f) 410–610 cm−1 and g) 410–610 cm−1 during the first charging/discharging process. h) ToF‐SIMS spectra of depth profiles of representative Si− and F− collected from the Si/C@CNTs@BNT and Si/C@CNTs anodes after five cycles. i) 3D rendering of LiF− and Si− secondary ion distribution of cycled anodes.
