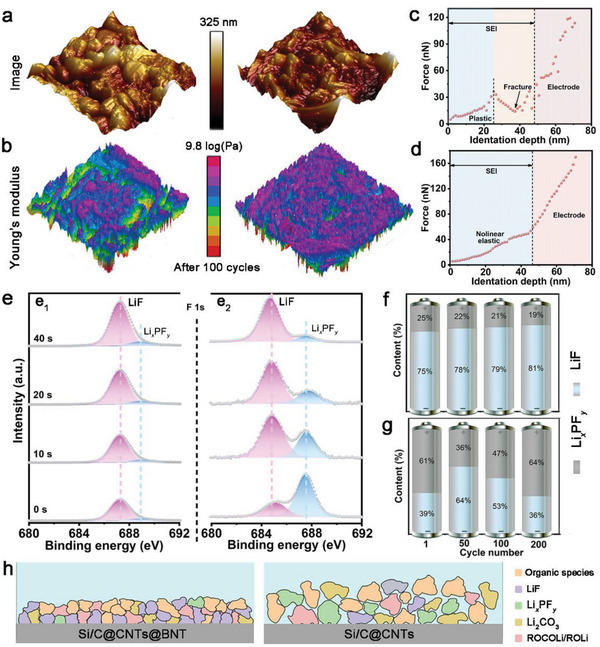
Figure 6.

a) 3D AFM images and b) Young's modulus mappings of the two materials after 100 cycles. a thorough examination of SEI's representative force spectroscopy on c) Si/C@CNTs and d) Si/C@CNTs@BNT. e) High‐resolution XPS spectra of F 1s of (e1) Si/C@CNTs@BNT and (e2) Si/C@CNTs. Contents of LiF and Li x PF y from F 1s spectra after the initial lithiation procedure and different cycles for f) Si/C@CNTs and g) Si/C@CNTs@BNT. h) Diagram demonstration of the SEI generated on both electrodes.
