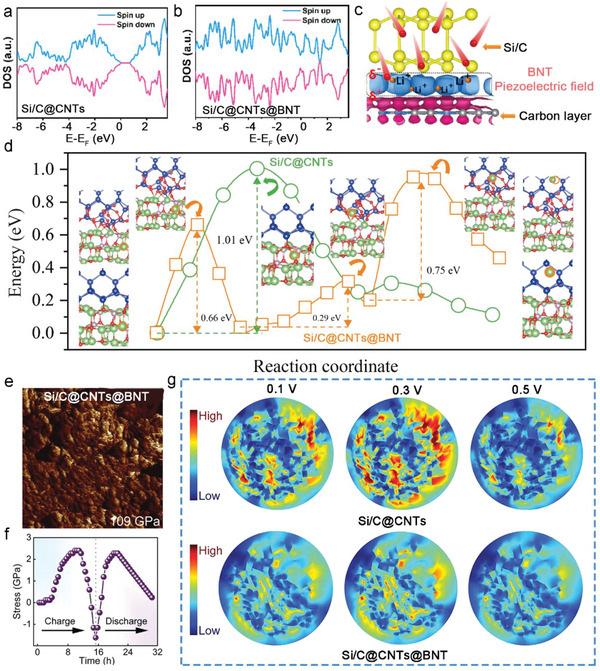
Figure 7.

Total density of states of the a) Si/C@CNTs and b) Si/C@CNTs@BNT. c) The charge density difference at the heterointerface from Si/C@CNTs@BNT (blue indicates charge accumulation, while red indicates depletion). d) Nudged elastic band (NEB) calculation of the transition state energy during Li+ diffusion on the surface of Si/C@CNTs (green line) and Si/C@CNTs@BNT (orange line). The individual images for each transition state and the initial and final states are presented. e) Stress curves for Si/C@CNTs@BNT during initial cycle. f) The simulation results of the stress piezoelectric potential for the pure BNT material at fully c) lithiated and d) delithiated states. g) tension stress distribution for Si/C@CNTs and Si/C@CNTs@BNT particles at different voltage.
